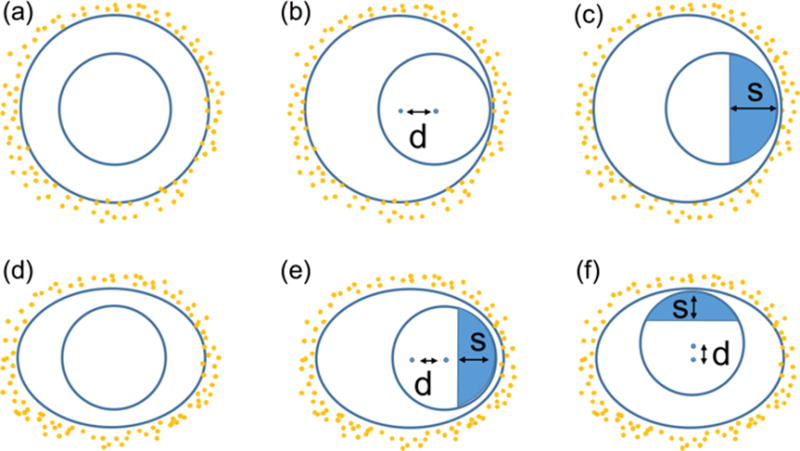
Fig. 3.

Schematic diagram of cell and nucleus used for the GNP-LEM. (a): Circular cell with centrally located nucleus; (b): Circular cell with shifted nucleus; (c): Circular cell with shifted nucleus and sub-regions in the nucleus; (d)-(f): Similar for elliptical cell with nucleus shifted along major and minor axis (d = distance between centre of cell and nucleus). The parameter s gives the size of the sub-regions in nucleus to calculate mean dose enhancement.
