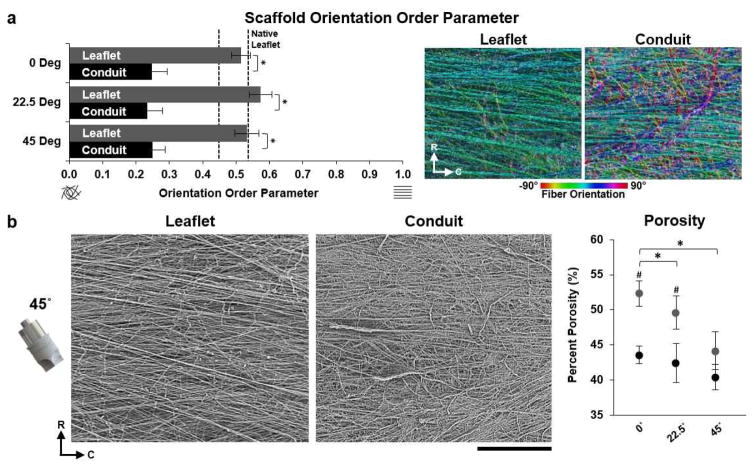
Fig. 4.
JetValve leaflet/conduit anisotropy and porosity. (a) JetValve leaflet anisotropy was comparable to native anisotropy, as indicated by OOP, and was significantly more anisotropic than the conduit for each collection angle. Colorized SEM images, right, indicate local fiber direction, (R) indicates radial direction and (C) indicates circumferential direction (N=3 production runs per condition and N=7 native leaflets, *p<0.5 comparing leaflet vs. conduit). (b) Representative SEM images of JetValve leaflet and conduit scaffold collected at 45° (scale bar 500μm). Porosity of leaflets and conduits as a function of collection angles (N=3 production runs per condition, *p<0.5 comparing angles and #p<0.5 comparing leaflet vs conduit for a given angle). Data presented as mean ± s.e.m. (leaflet: grey, conduit: black).

