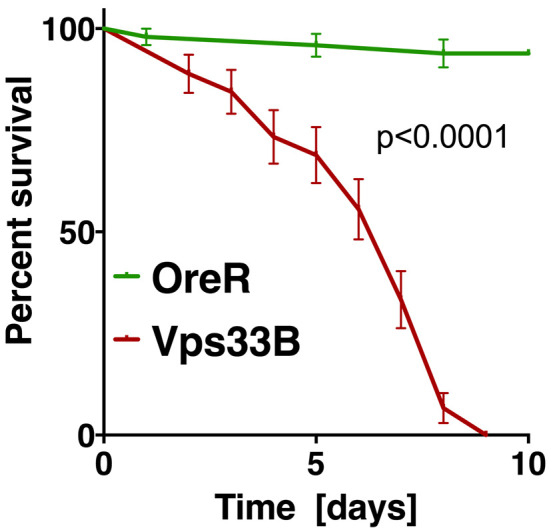
Figure 4. Example of statistical analysis of fly survival post bacterial infection.

The diagram shows the fraction of surviving wild-type flies (OreR) or Vps33B mutants after injection with heat-killed E. coli, similar to experiments previously published ( Akbar et al., 2016 ). Statistical analysis was performed in Prism using the Log-rank (or Mantel-Cox) test to determine a P value smaller than 0.0001.
