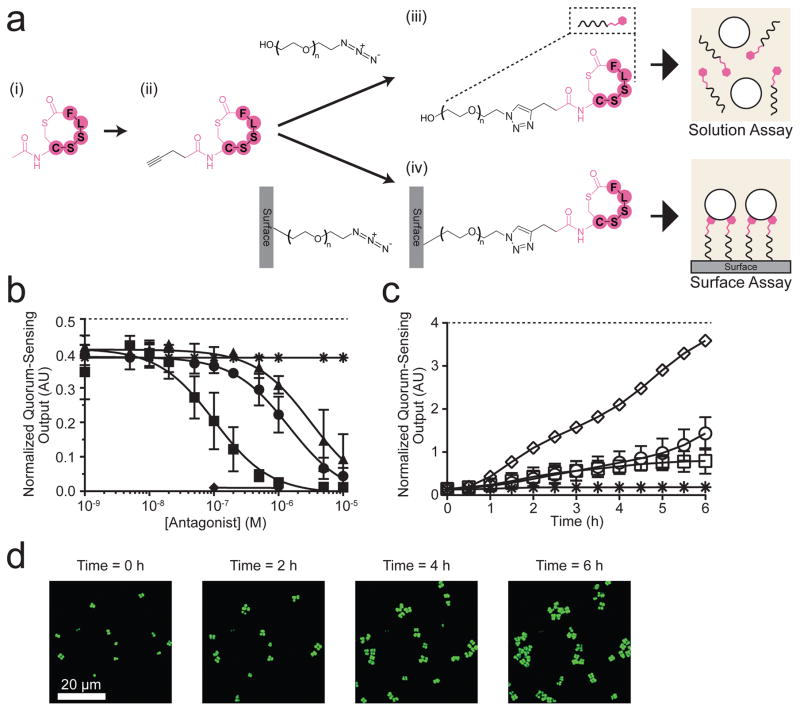
Figure 3. A surface-attached Agr quorum-sensing antagonist, TrAIP-II, inhibits the S. aureus quorum-sensing response to AIP-I.
a, Strategy for modification of TrAIP-II and attachment to the surface; (i) TrAIP-II, (ii) Alkyne-TrAIP-II, (iii) PEG330-triazole-TrAIP-II, and (iv) Surface-PEG10000-triazole-TrAIP-II. b, The S. aureus Agr quorum-sensing reporter assay in solution with 100 nM AIP-I (asterisks), TrAIP-II + 100 nM AIP-I (circles), Alkyne-TrAIP-II + 100 nM AIP-I (squares), PEG330-triazole-TrAIP-II + 100 nM AIP-I (triangles), PEG330-triazole-TrAIP-II (diamonds). Normalized Agr quorum-sensing outputs were measured as a function of the concentrations of TrAIP-II and its derivatives. PEG330-triazole-TrAIP-II (diamonds) was measured at only the two highest concentrations due to limitations in available quantities of the reagent. Data points indicate means and error bars denote standard deviations from n = 4 experiments. c, The Agr quorum-sensing surface inhibition assay was performed with 30 nM AIP-I in solution and the following surfaces: Surface-PEG10000-triazole-TrAIP-II (asterisks), Surface-PEG10000-azide (circles), and Surface-PEG10000-triazole-Linear-TrAIP-II (squares). We also added 1 μM AIP-I in solution with the Surface-PEG10000-triazole-TrAIP-II (diamonds). The normalized Agr quorum-sensing outputs were measured for 1000 – 4000 individual cells in each experiment. Data points indicate means and error bars denote standard deviations from triplicate experiments. An ANOVA test with Tukey-Kramer post hoc analysis was used to assess the statistical significance between the means for the TrAIP-II coated surface and the control surfaces using the T = 6 h data (P < 0.0001 for all pairwise comparisons). d, Merged fluorescence images of the S. aureus reporter strain on the Surface-PEG10000-triazole-TrAIP-II + 30 nM AIP-I in bulk at T = 0, 2, 4, and 6 h. Images are based on n = 3 independent experiments; one representative image for each condition was chosen from ~ 50 images acquired from different regions of each surface. Scale bars: 20 μm.

