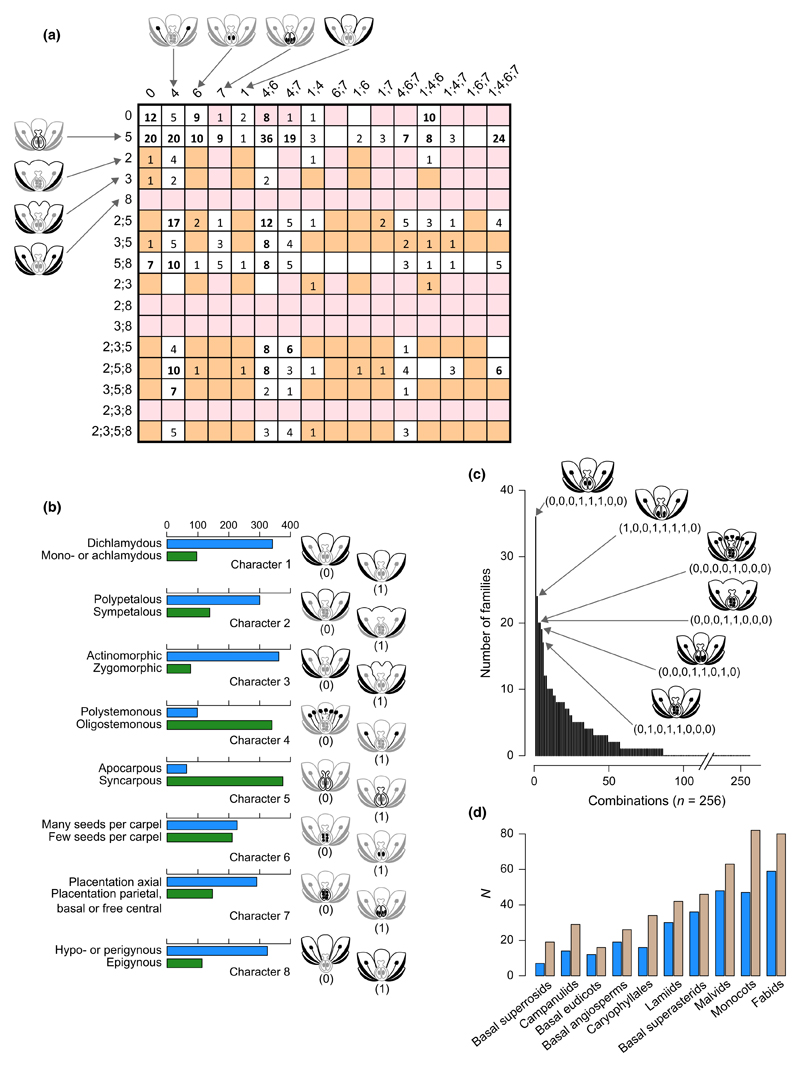
Fig. 4.
Stebbins’ (1951) floral morphospace. (a) An adaptation of Stebbins’ original chart. Numbers in front of rows and on top of columns indicate characters under state ‘1’ (called ‘advanced’ in Stebbins’ article). For example, the top left square corresponds to the combination in which all characters are under state ‘0’ (called ‘primitive’ in Stebbins’ article); the square formed by the second row and the sixth column corresponds to the combination were characters 5, 4 and 6 are in state ‘1’ and all other characters are in state ‘0’; the bottom right square corresponds to the combination where all eight characters are in state ‘1’. Numbers in each square represent the number of angiosperm families for which the corresponding combination has been recorded. Combinations that were interpreted as ‘nearly impossible’ by Stebbins are highlighted in pink; the ones associated with ‘low survival’ are highlighted in orange (see Stebbins (1951) for further details and full interpretation). Figure redrawn, with permission, from Stebbins (1951) © John Wiley & Sons Inc. (b) Frequency of the 16 character states (2 per character) in angiosperm families according to Stebbins’ dataset. Each of the character states is schematized. Horizontal bars give the number of angiosperm families for which each character state was recorded by Stebbins (1951; see Supporting Information Table S1). (c) Frequency diagram of the 256 morphological character state combinations from Stebbins (1951). Binary vectors and schematizations of the six most successful combinations are given on the right part of the plot. (d) Number (N) of angiosperm families per angiosperm subgroup: as recorded in the sampling of Stebbins (1951) (blue bars) and as present in the APG III (2009); Stevens, 2001) classification (brown bars).

