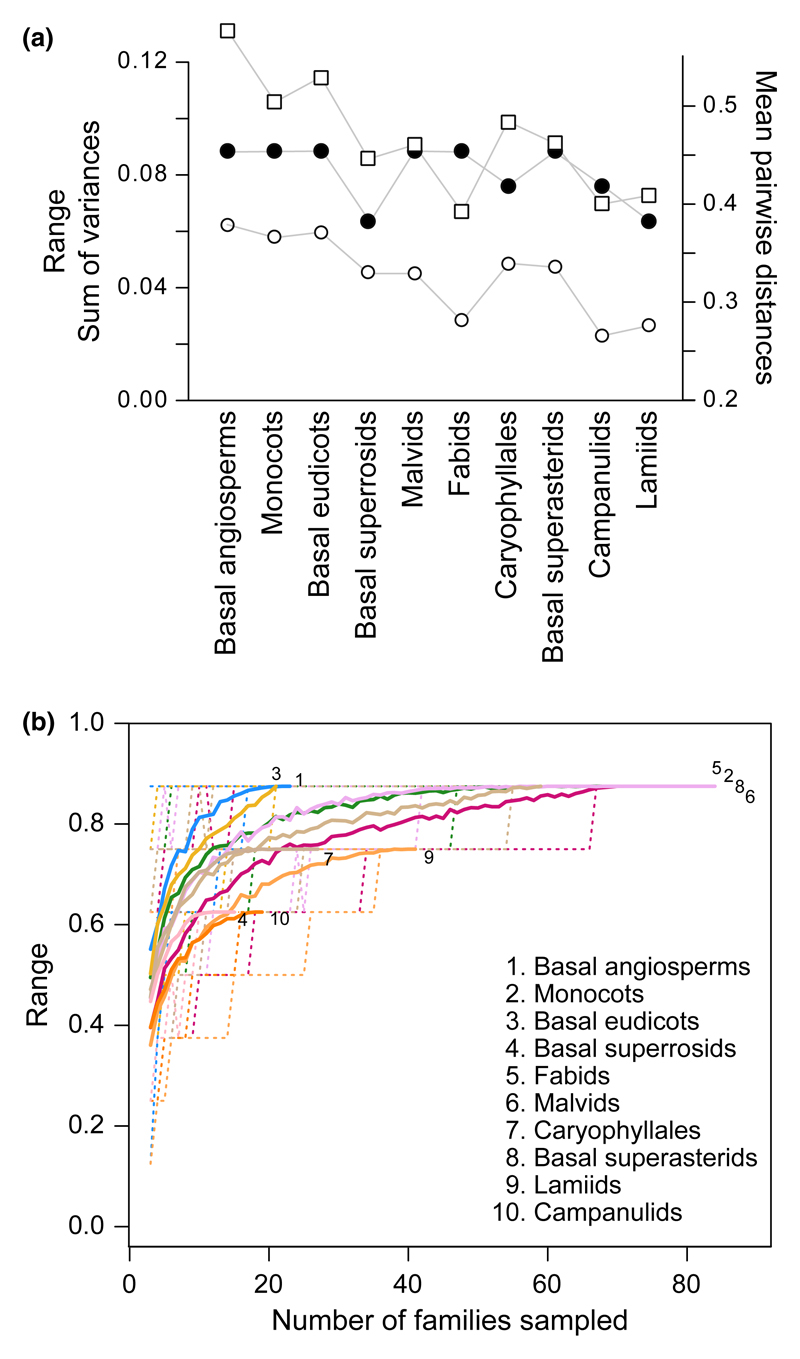
Fig. 6.
(a) Disparity indices calculated for 10 angiosperm subgroups out of Stebbins’ (1951) dataset. Mean pairwise distances (open circles), range (closed circles), and sum of variances (open squares). (b) Rarefaction curves for the range. Curves represent the mean (solid lines) and 90% confidence intervals (dashed lines) of the indices calculated from 200random samplings without replacement for each sampling size.

