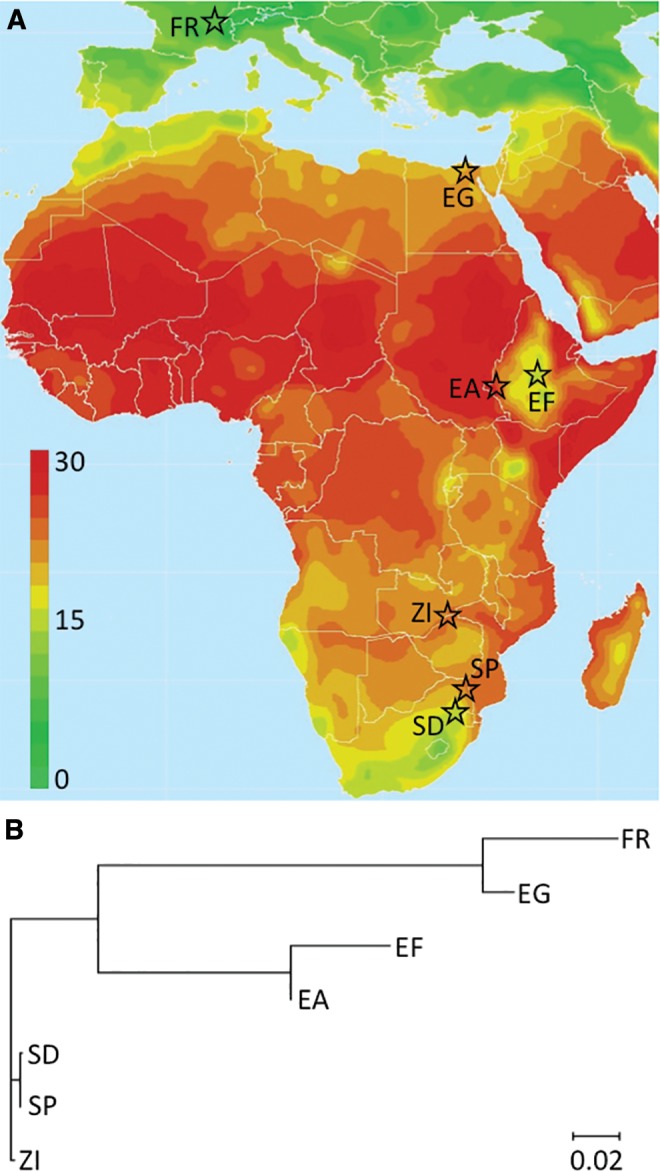
Fig. 1.

(A) Geographic locations and mean temperatures of the studied populations are depicted. We compare three pairs of cold-/warm-adapted populations: France/Egypt and highland/lowland populations from Ethiopia and from South Africa. The origin of the ancestral range Zambia sample used in population genomic analyses is shown as well. The source map indicating average temperature (°C) is courtesy of The Nelson Institute, Center for Sustainability and the Global Environment, UW-Madison. (B) A neighbor-joining tree, based on transformed genome-wide average FST values (Cavalli-Sforza 1969) and rooted along the branch to ZI, was generated using MEGA 7.0.16 (Kumar et al. 2016).
