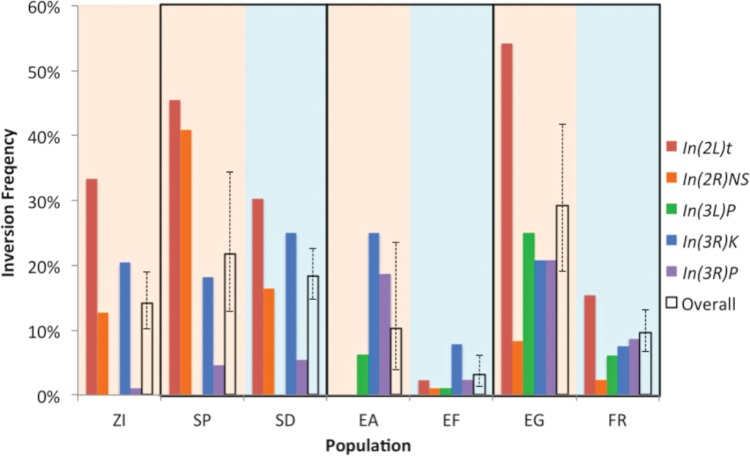
Fig. 2.
The frequencies of the five most common inversion polymorphisms tend to decrease in cold-adapted populations (blue background) relative to closely related warm-adapted populations (tan background in same box). Further results of this inversion PCR testing are given in supplementary table S3, Supplementary Material online. Also plotted is each population’s overall proportion of inverted chromosome arms (for X, 2L, 2R, 3L, and 3R), along with 95% confidence intervals. Significant differences were detected between EG and FR, and between EA and EF, but not between SP and SD.

