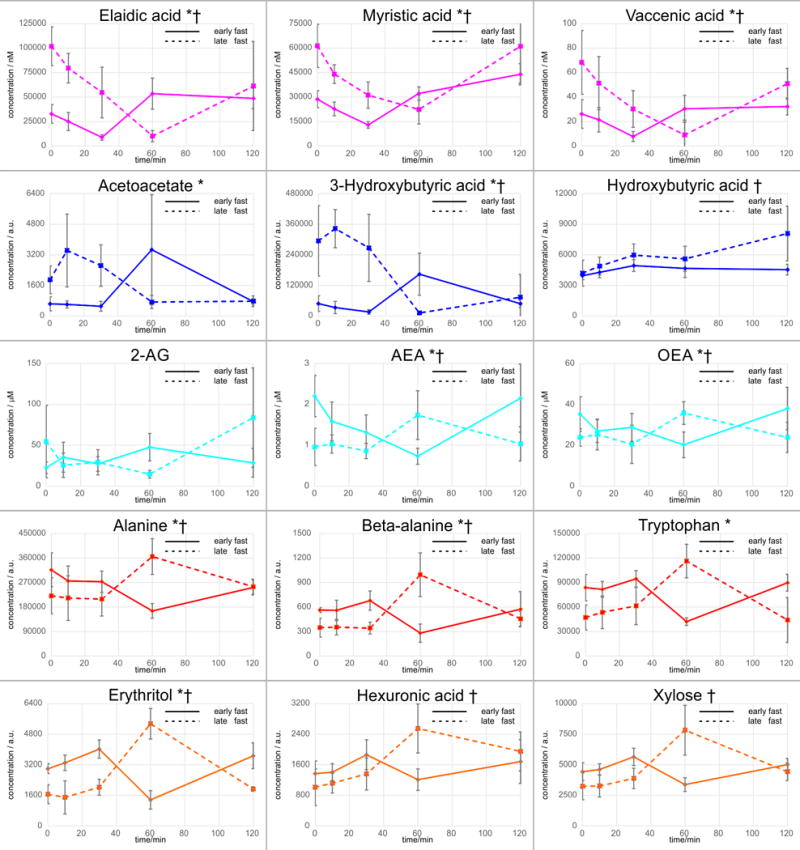
Figure 2.

Mean abundances ± standard deviation of metabolic trajectories (t = 0 to 120 min) for those metabolites which indicated significantly (raw p-value < 0.05) different AUCs (Table 1) during insulin infusion between early to late fasting mammals is shown. †Endocannabinoid and Endocannabinoid-like compounds are presented as nM; *free fatty acids are presented as μM
