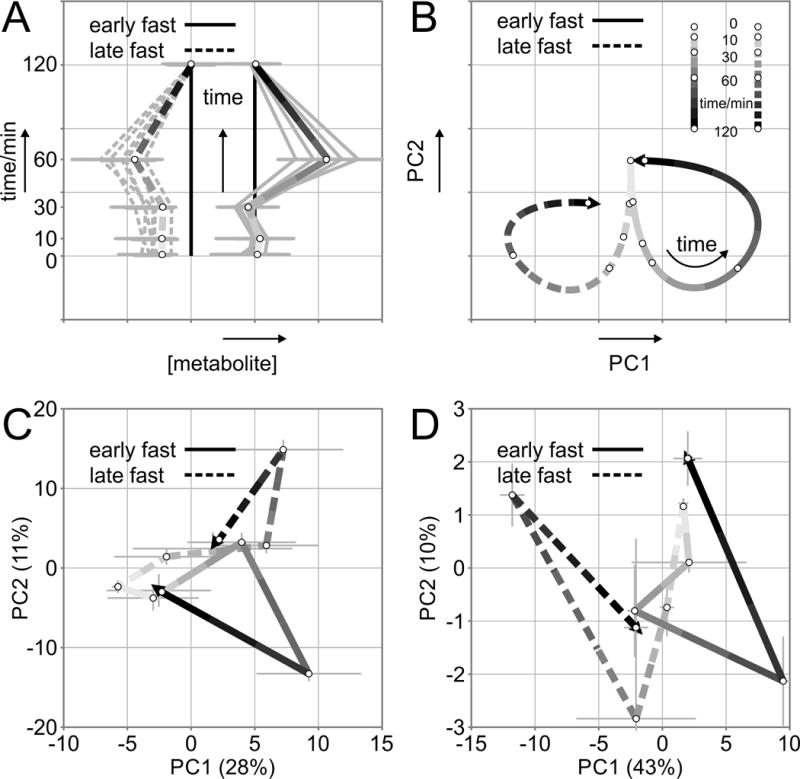
Figure 3.

Schematic representation of a metabolite trajectories, and b principal component analysis plot explaining difference in outcome and direction of early- (solid line) and late-fasted (dashed line) response over time. Principal component analysis scores displaying the median points (±standard error) for early- and late-fasted northern elephant seal pups in response to exogenous insulin infusion for c all measured metabolites and d orthogonal partial least squares discriminant analysis selected top 10% of all discriminating metabolites. The line color becomes darker as the time course runs from the first point (t = 0) to the end point (t = 120 min, arrowhead). Solid lines = early fast, dashed lines = late fast
