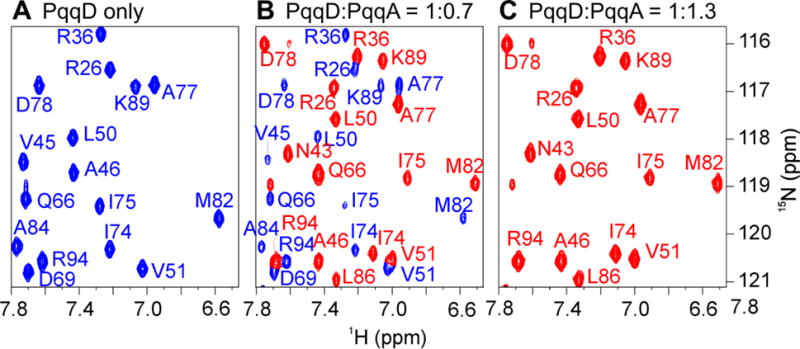
Figure 4.

(A). 1H,15N-HSQC for PqqD alone. (B) The spectrum before saturation at a PqqD:PqqA ratio of 1:0.7. Peaks colored based on assignment to PqqD alone (panel A) or the PqqD + PqqA complex (panel C). (C) The fully evolved spectrum indicating saturation at a ratio of 1:1.3.
