
Figure 5.
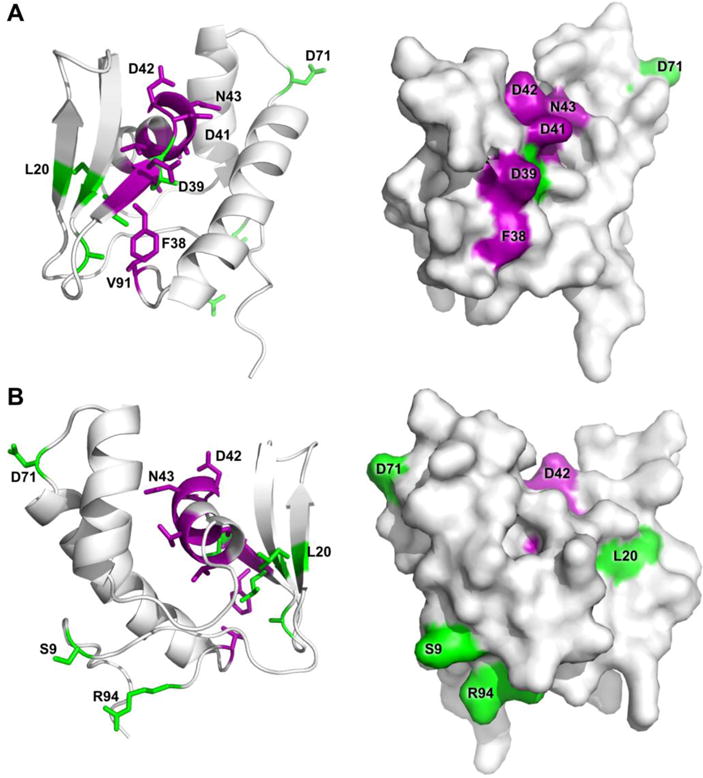
PqqD residues identified as having 1H,15N-HSQC peak shifts ≥ 1.5σ above the mean shift are indicated for the complex with PqqA (purple) along with additional residue peak shifts upon addition of PqqE to the PqqD + PqqA complex (green). Ternary complex interactions are based on chemical shifts of the backbone only, however sidechains are displayed for recognition ease. PqqD cartoon and molecular surface renderings from the same viewpoint are shown in each panel, with panel B being a 120° rotation of panel A around an axis vertical in the plane of the paper.