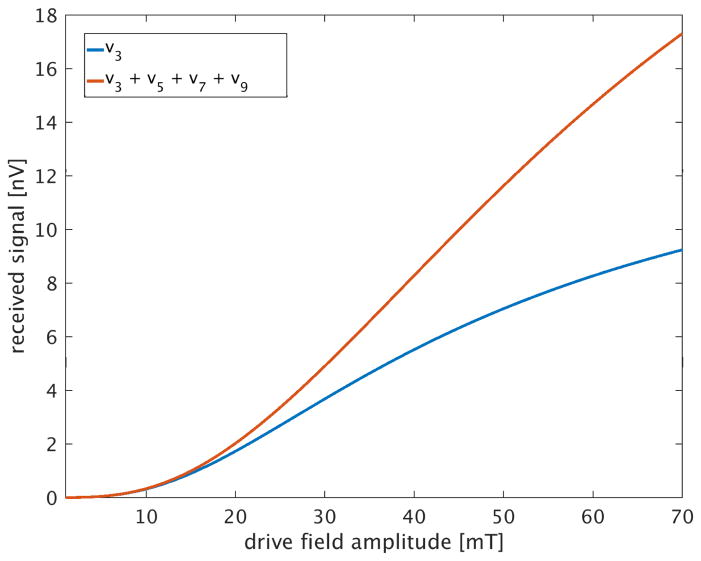
Figure 9.
Comparison of frequency component contributions to received signal versus the 10 kHz drive field amplitude. Input object is 22 ng Fe sample at center in 2.3 mm3 volume. A 1.6ms scan measures the signal at the center point in projection axis. No noise added to signal. Receive coil is human head-sized solenoid (r = 12 cm, l = 24 cm, 25 turns; coil (c) of Tab. 1). Blue curve is the 3rd harmonic frequency component; orange curve is the sum of the 3rd, 5th, 7th and 9th harmonic frequency components, for drive field amplitudes from 1 mT to 70 mT. With a tuned circuit or impedance transformer in the receive path, the voltages received will be “stepped-up” to a considerably higher value at the preamplifier input.

