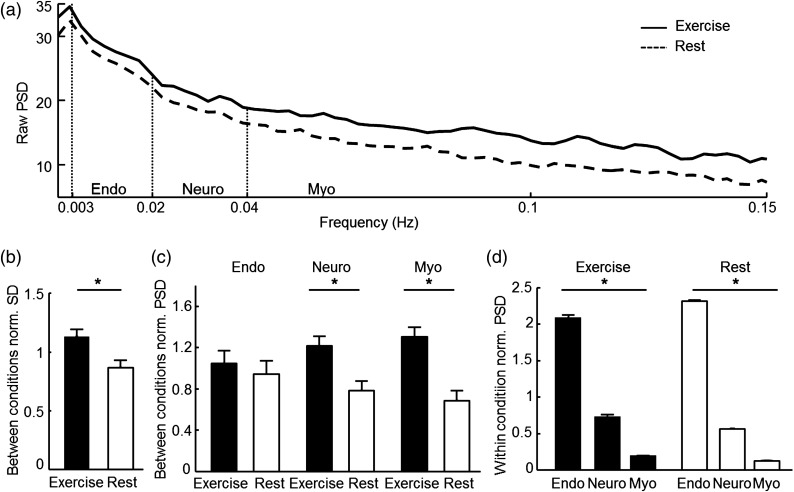
Fig. 4.
HHb NIRS results. (a) Group power spectrum density plot from cerebral HHb (b) Normalized SD of the HHb signal was significantly higher during exercise than during rest. (c) Relative mean normalized PSDs between conditions (exercise and rest). (d) Relative mean normalized PSDs within condition.

