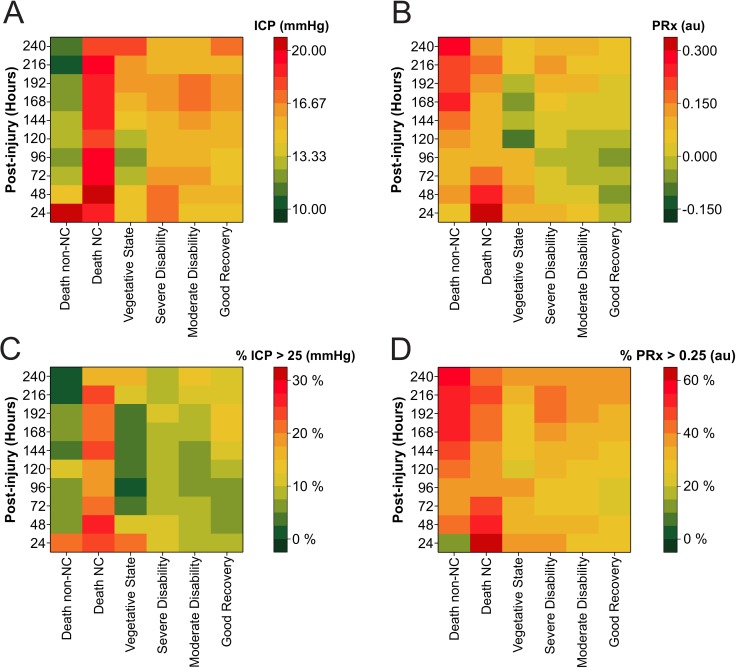
Fig 1. Heatmap illustrating levels of intracranial pressure (ICP) and pressure reactivity index (PRx) in 601 severe traumatic brain injury (TBI) patients stratified by different levels of functional outcome.
The colour code represents (A) mean ICP, (B) mean PRx, (C) percent time spent ICP > 25 mmHg, and (D) percent time spent PRx > 0.25 for each 24-hour epoch following injury. Tabulated heatmaps are available as supporting information (Table A–D in S3 Supporting Information). Abbreviations: NC, neurological cause.

