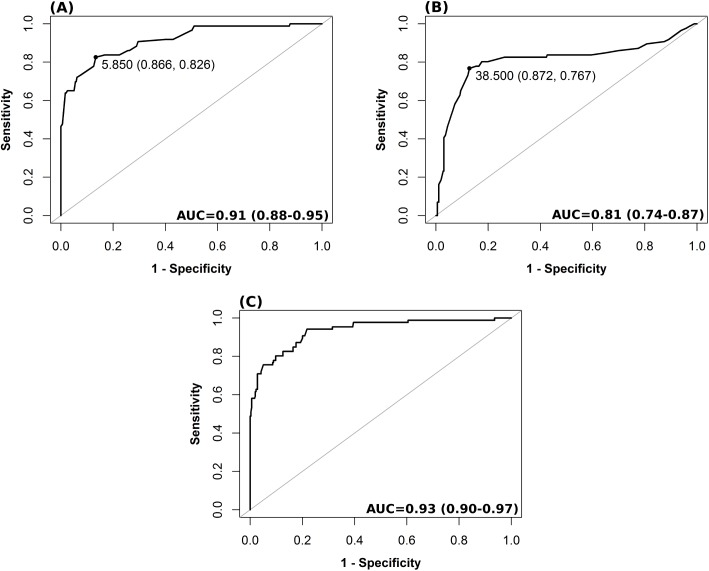
Fig 2. Receiver operating characteristic analysis for different nICP predictors for a threshold of ICP ≥ 20 mm Hg.
(A) ONSD method; (B) FVsv; (C) nICP estimator based on the combination of ONSD and FVsv (nICPONSD+FVsv). The values shown on the curve in (A) and (B) represent the best thresholds (cutoff values presenting the best sensitivity and specificity [in parentheses]) for prediction of intracranial hypertension (ICP ≥ 20 mm Hg), respectively, for ONSD and FVsv. AUC is presented followed by the 95% confidence interval. AUC, area under the curve; FVsv, straight sinus systolic flow velocity; ICP, intracranial pressure; nICP, non-invasive intracranial pressure; ONSD, optic nerve sheath diameter.

