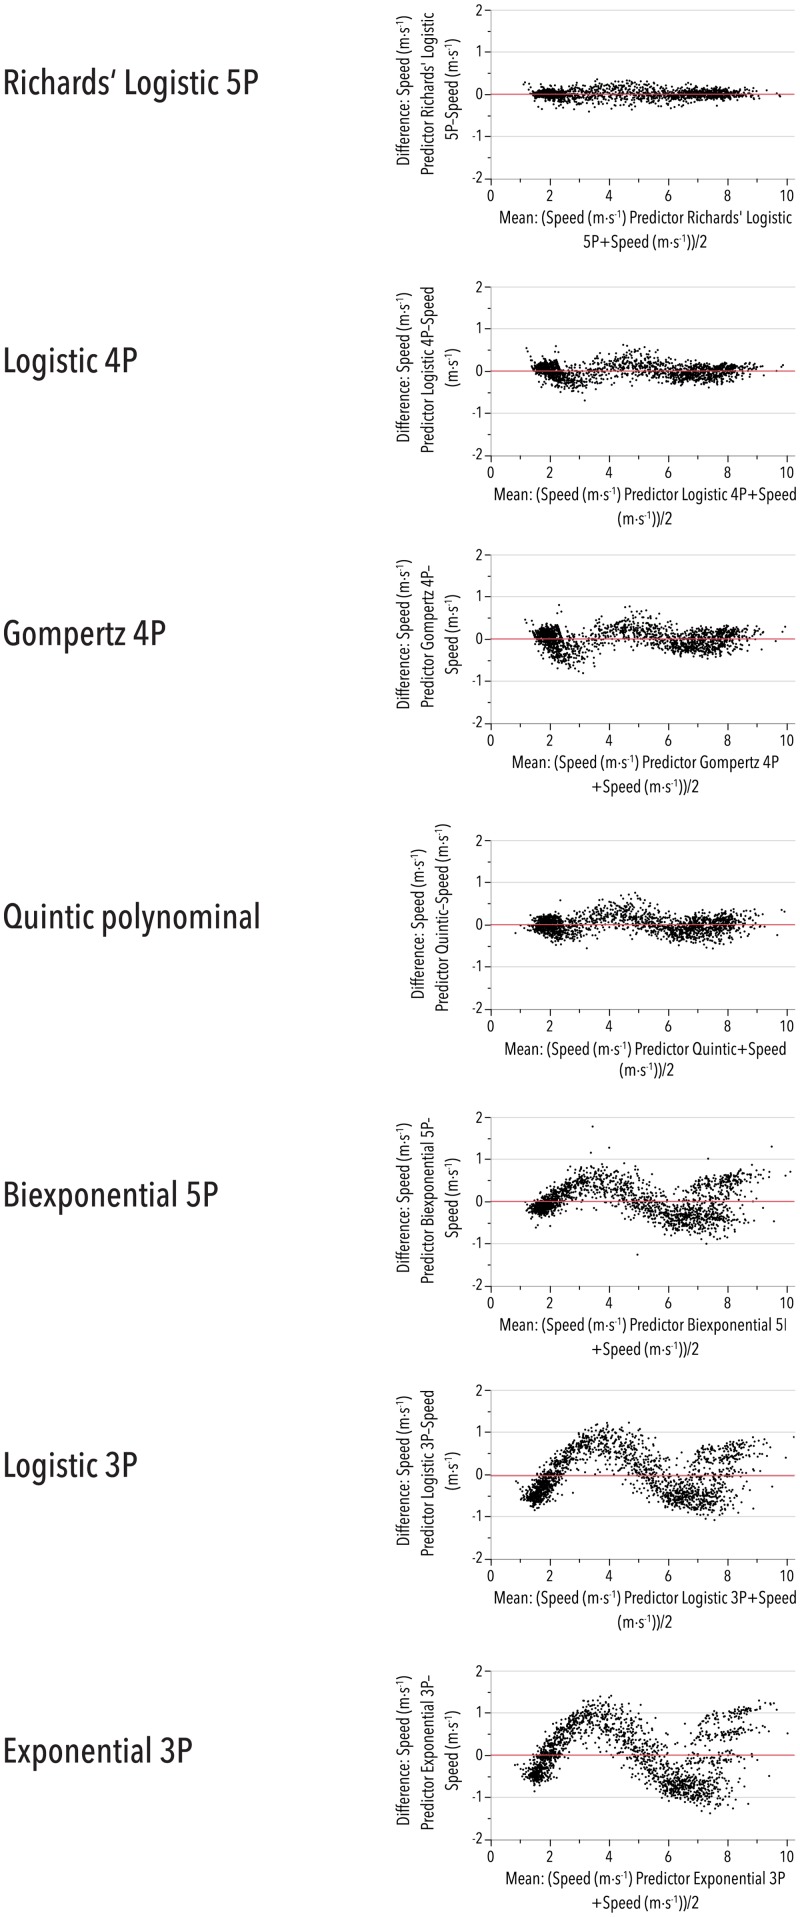
Fig 2. Residuals of the seven evaluated fitting equations.
The differences between the measured and the predicted values against the mean between both are shown. Only the Richards' Logistic 5P equation (Eq. 8, S1 Appendix) does not display a systematic deviation from the measurements. For further descriptions of the applied equations, see the S1 Appendix.

