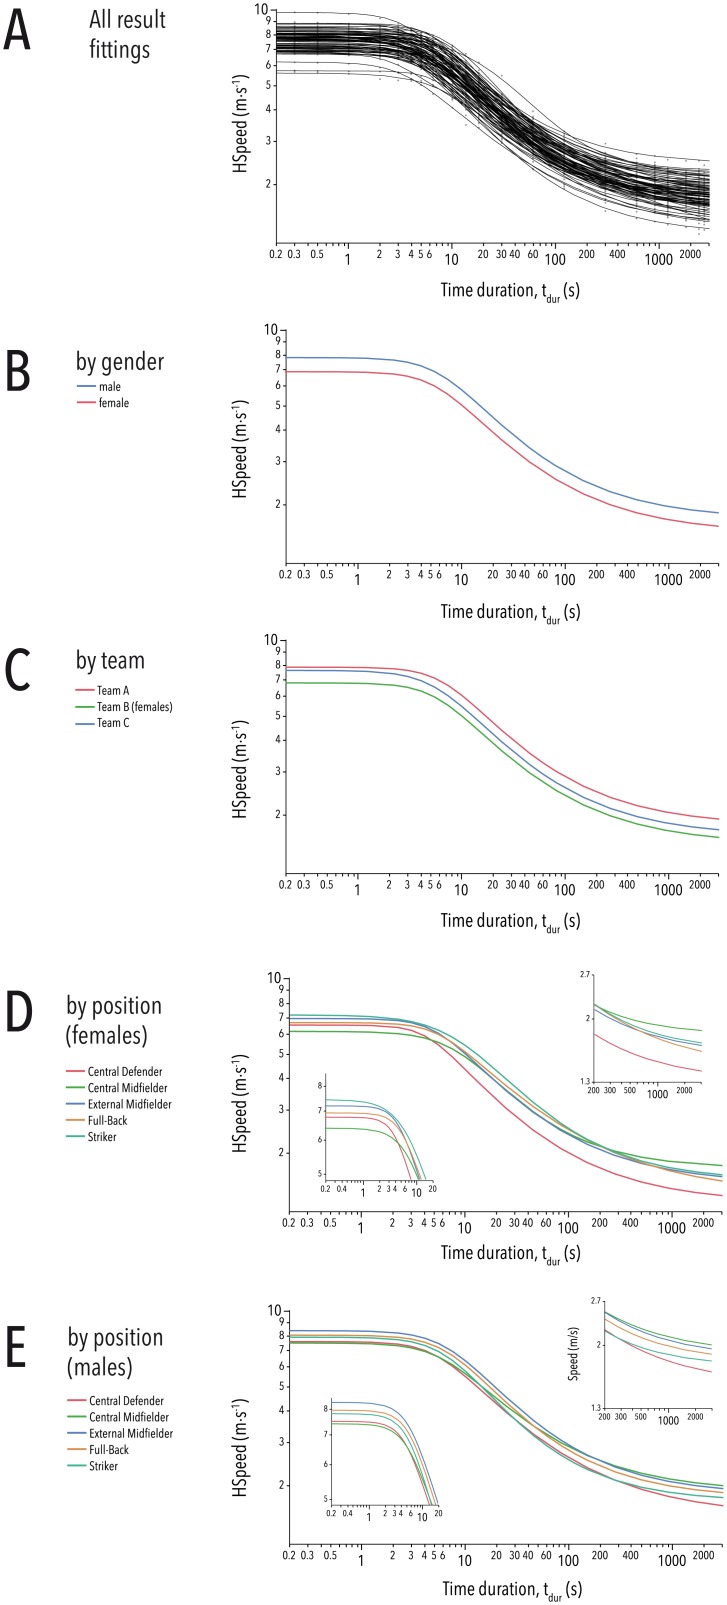
Fig 3. Groups of power-profile curve fittings.
(A) All fitting results. (B) Fitting results grouped by gender (blue: male, red: female). (C) Fitting results grouped by team (red: Team A, green: Team B, blue: Team C). (D) Fitting results of all female participants, grouped by position (red: Central Defenders, green: Central Midfielders, blue: External Midfielder, orange: Full-Backs, cyan: Strikers). (E) Fitting results of all male participants, grouped by position (red: Central Defenders, green: Central Midfielders, blue: External Midfielder, orange: Full-Backs, cyan: Strikers). HSpeed was log-transformed for better clarity in all cases. The close-ups in (D) and (E) show the upper and the lower part of the fittings, respectively.

