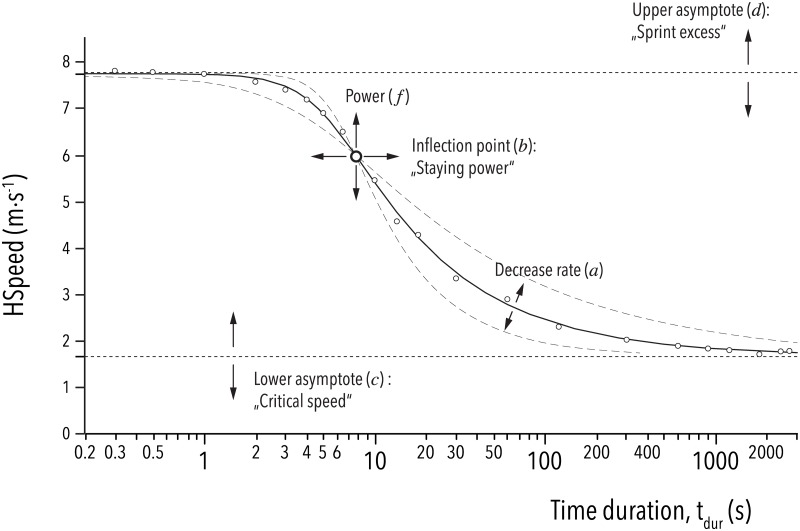
Fig 5. Graphical description of the fitting parameters.
The five parameters within the favored fitting model for the relationship between HSpeed and tdur (Eq. 8, S1 Appendix). Small open circle symbols (o) are from real results for one participant in one game.

