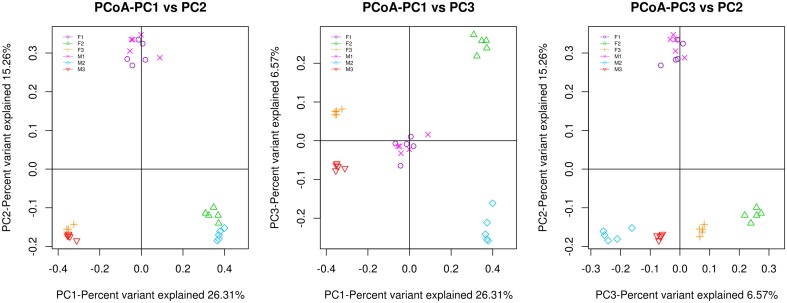
Fig 3. The multivariate principal coordinate data analysis of the groups.
F1, female control group; F2, female mice treated with florfenicol; F3, female mice treated with azithromycin; M1, male control group; M2, male mice treated with florfenicol; M3, male mice treated with azithromycin. Each group has ten mice (5 male and 5 female subjects). PC1 and PC2 are the two principal coordinate components. PC1 indicates the maximum possible interpretation of the main components of the data variations. PC2 represents the largest proportion of interpretation of remaining variations, etc.

