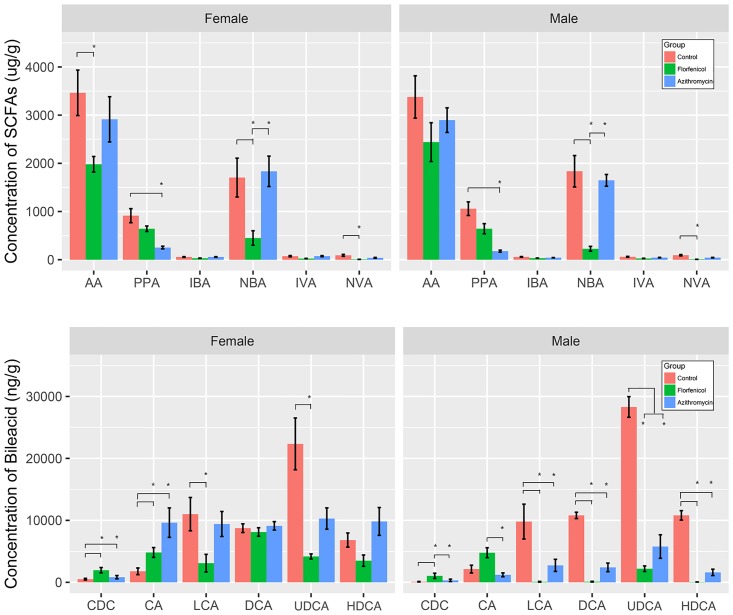
Fig 6. Concentration of SCFAs and bile acids in samples from the normal and antibiotic-treated groups.
One-way analysis of variance (one-way ANOVA) and multiple t-tests with Bonferroni correction were employed to measure the concentration differences in bile acids and SCFAs between the three groups. * indicates that the difference between the two line-linked groups was statistically significant (p < 0.05).

