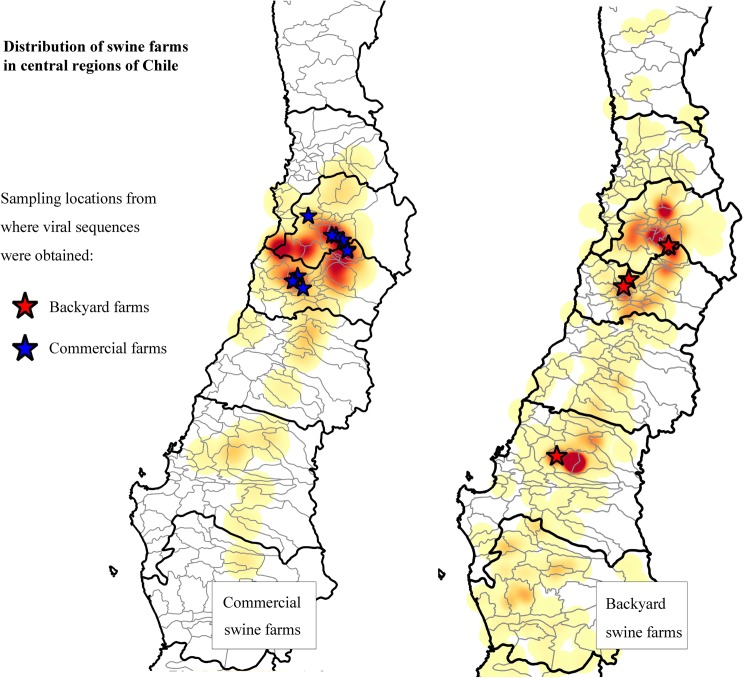
Fig 2. Map of sampled Chilean commercial and backyard swine during the national PRRS control and eradication program.
The density of commercial and backyard farms in the central region in Chile is represented as a color gradient. Locations from where sequences were obtained are identified with stars.

