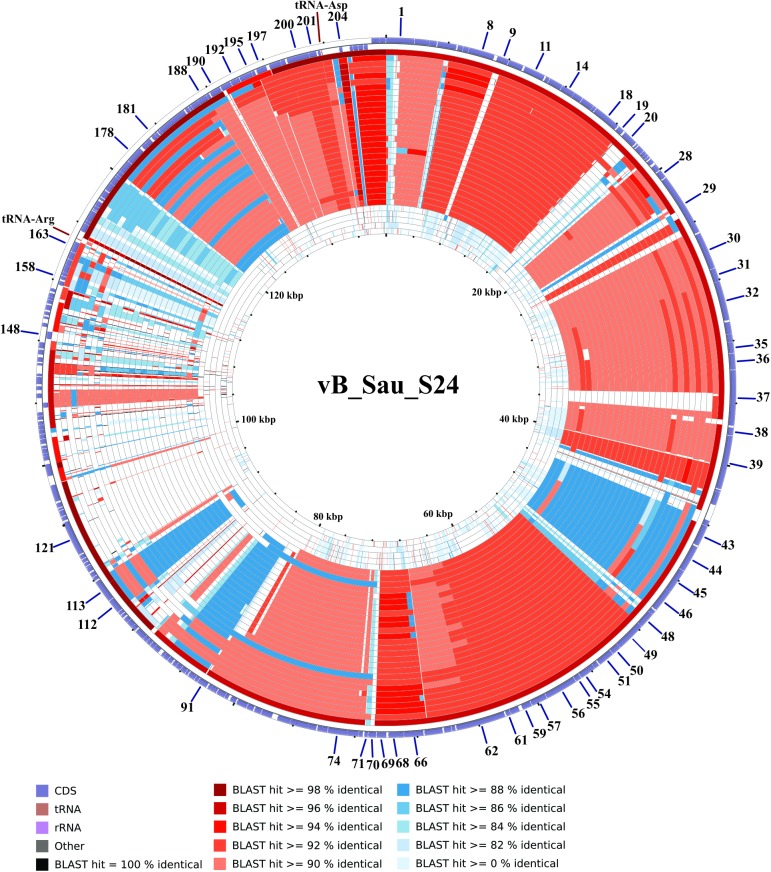
Fig 6. CCT map comparing the genome of phage vB_Sau_S24 to other S. aureus myobacteriophages.
The most external ring in the graph corresponds to vB_Sau_S24 used as a reference genome. The next 32 rings correspond to BLASTN alignment of the each genome analyzed, the color correspond to the percent of sequence similarity (see below panel).

