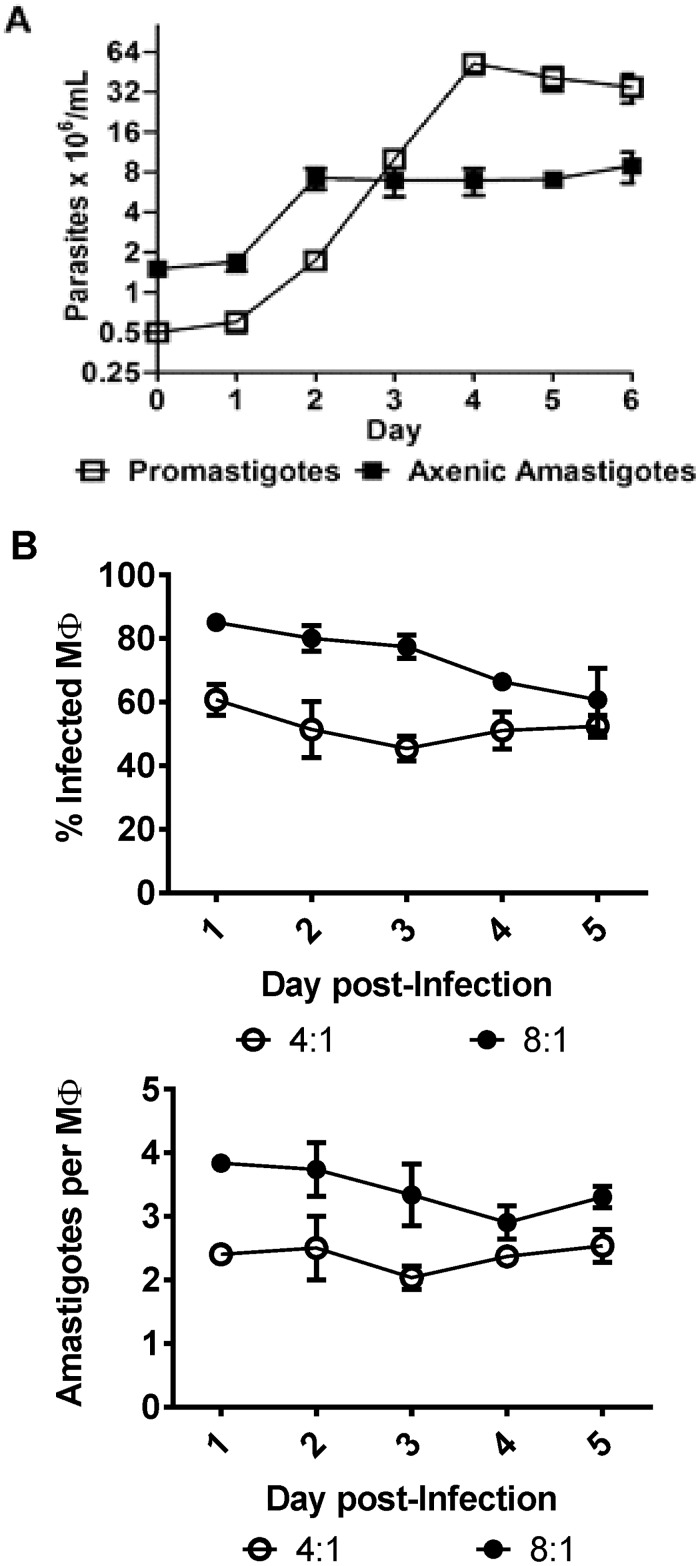
Fig 1. L. (V.) braziliensis growth kinetics.
A, In vitro growth curve of promastigotes and axenic amastigotes. B, Kinetics of in vitro infection of Amaint in macrophages, using 2 different infection ratios (4:1 and 8:1). The average of three biological replicates and standard errors of the means (SEM) are presented.

