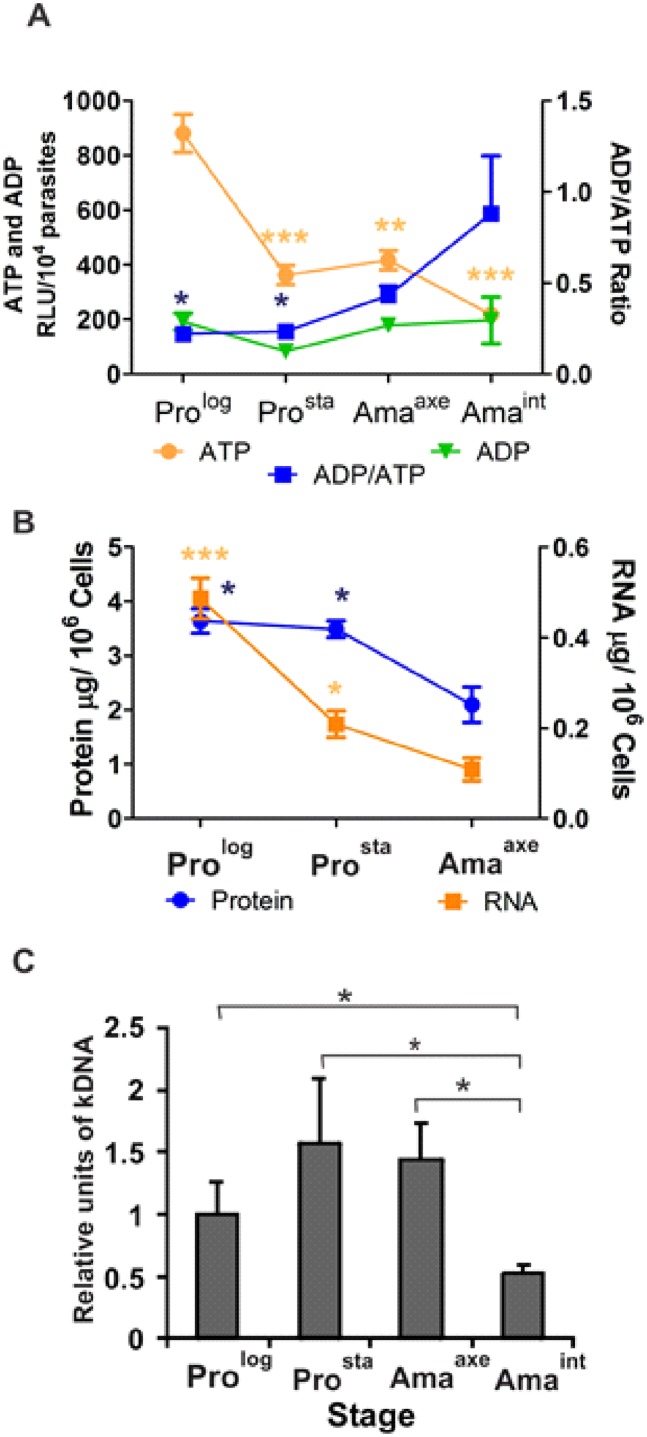
Fig 2. Quantification of ATP/ADP, total RNA, protein content and kDNA minicircles during the life cycle of L (V.) braziliensis.
A, Amaint, Amaaxe and Prosta show decreased levels of ATP in comparison to Prolog. The asterisks represent statistically significant differences in comparison to Prolog. Because of the decreased levels of ATP, ADP/ATP ratio is increased in Amaint in comparison to the Prolog and Prosta. The asterisks represent statistically significant differences in comparison to Amaint. B, The Amaaxe show a decrease in the total content of RNA and protein in comparison to Prolog and Prosta. The asterisks represent statistically significant differences in comparison to Amaaxe. C, The kDNA mini circles decrease in Amaint in comparison to Prolog, Prosta and Amaaxe. The asterisks represent statistically significant differences after multiple t-test between all the pairs. The number of asterisks in figures A and B represents different significance levels (* P ≤ 0.05 and ** P ≤ 0.01) using one-way ANOVA followed by the Bonferroni's Multiple Comparison Test.

