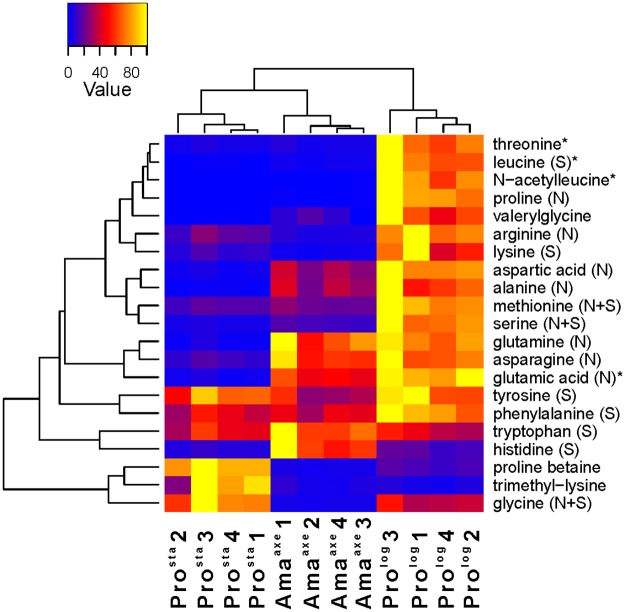
Fig 5. Metabolic profiles of amino acids and derivatives in heatmap format.
The samples are presented along the bottom (Prosta, Amaaxe, Prolog, the numbering represent the biological replicate). For each metabolite, its abundance over the different biological replicates was rescaled between 0 (blue) and 100 (yellow). The corresponding fold changes between conditions are displayed in S3 Table. On the right, the amino acids and derivatives are represented (S: salvage (essential) amino acids, N: de novo (non-essential) amino acids, N+S: amino acids that can be both synthesized de novo and salvaged, but an incomplete pathway for de novo synthesis is described in the Leishcyc and KEGG metabolic databases). The asterisk indicates that another isomer was detected for this metabolite (see S2 Table for more details). The branches represent the dendrogram after hierarchical cluster analysis.

