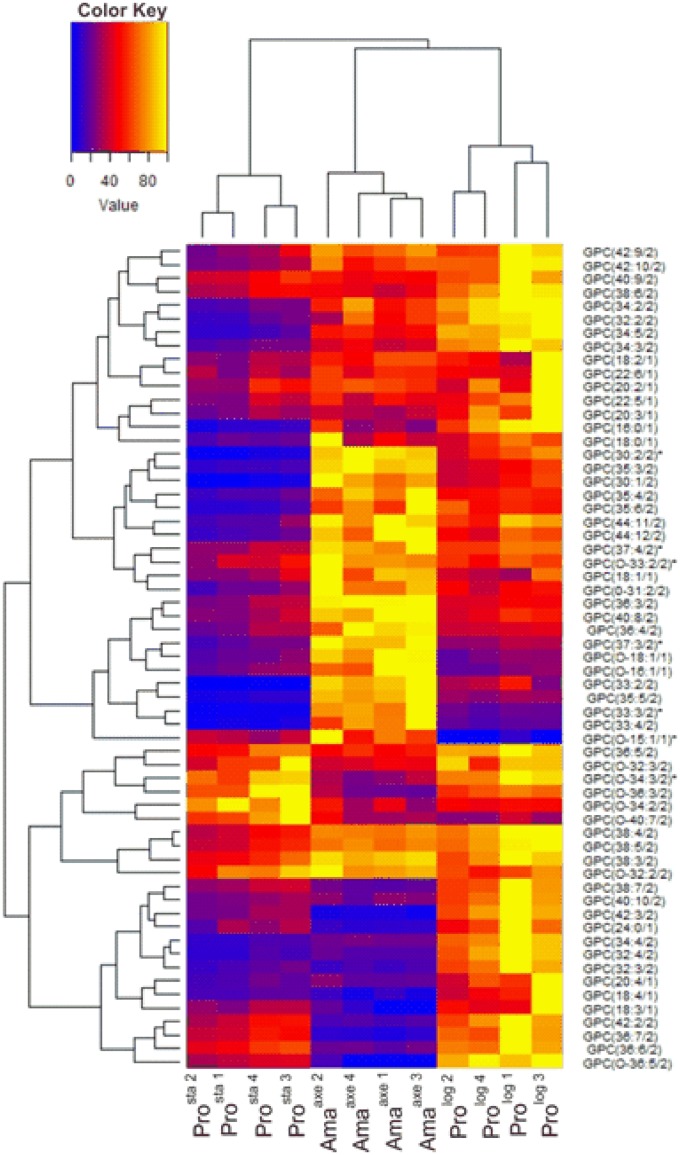
Fig 7. Metabolic profiles of GPCs in heatmap format.
The samples are presented along the bottom (Prosta, Amaaxe, Prolog, the numbering represents the biological replicate). The branches on the top and on the left represent the dendrogram after hierarchical cluster analysis. For each metabolite, its abundance over the different biological replicates was rescaled between 0 (blue) and 100 (yellow). The corresponding fold changes between conditions are displayed in S4 Table. On the right, GPCs should be interpreted as follows: GPC (x:y/z), where x represents the number of carbons in the fatty acid side chain(s), y represents the number of double bonds, and z represents the number of side chains. The asterisk indicates that another isomer was detected for this metabolite (see S2 Table for more details).

