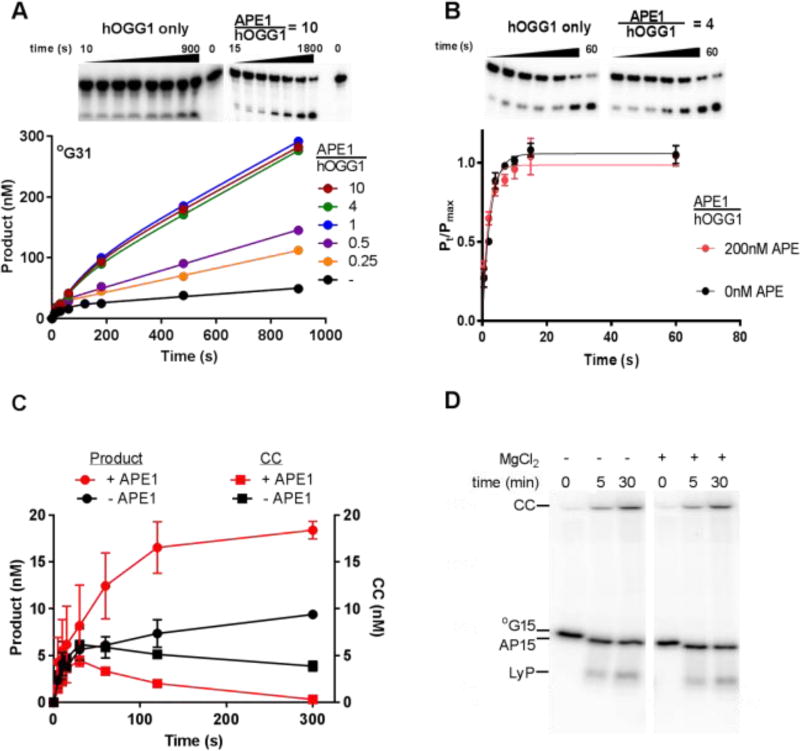
Figure 2. Effect of APE1 on hOGG1 turnover.
(A) APE1 concentration dependence of hOGG1 activity under multiple turnover conditions. The ratios of [APE1]/[hOGG1] are indicated above the representative gel images. The concentrations of hOGG1 and °G31 were 25 nM and 500 nM, respectively. All experiments where APE1 was present were carried out in buffer B, experiments in the absence of APE1 were carried out in buffer A. Control experiments shown in Fig. S1D confirmed that hOGG1 alone has the same steady-state kinetic activity in buffer A and B. (B) Effect of APE1 on the single turnover cleavage of °G31 by hOGG1. Reactions (buffer B) contained 10 nM °G31 and 50 nM hOGG1 in the absence and presence of 200 nM APE1 and were carried out in triplicate. The single-turnover cleavage rate was fit to a single exponential and was independent of hOGG1 concentration in the range 50 to 400 nM (see Fig. S2). (C) Kinetics of glycosidic bond cleavage and formation of the imino-sugar covalent linkage between 20 nM hOGG1 and 40 nM of 32P 5’-labeled °G31 at 37 °C (final concentrations were 10 nM hOGG1 and 20 nM °G31). Reactions were carried out in the absence and presence of 100 nM APE1, which was added to the DNA solution just prior to initiating the reaction with hOGG1. The covalent hOGG1-DNA complex was trapped by reduction with sodium borohydride and quantified by phosphorimaging after electrophoresis through an SDS-polyacrylamide gel. The amount of cleaved product DNA in the same reactions was determined by quenching time points in formamide in the absence of NaBH4 reduction followed by electrophoresis through a 10% polyacrylamide urea denaturing gel to separate substrate and product DNA. (D) hOGG1 has low lyase activity in the presence and absence of magnesium in buffer A. Two separate reactions were performed in which 200 nM hOGG1 was incubated at 37 °C with 50 nM °G15 DNA (5’-labeled with γ32P). One reaction was performed in the presence of buffer A, and the other was performed in the presence of buffer A with 1 mM MgCl2 substituted for EDTA. Time points were taken at 0, 5, and 30 minutes by mixing 5 µL aliquots of the reaction with 20 µL formamide load buffer containing 90% formamide, 1X TBE, bromophenol blue, and xylene cyanol. In order to maintain the integrity of the intact abasic and lyase cleaved products, there was no heating step prior to running the samples on a gel. Each time point was loaded onto a denaturing 20% polyacrylamide gel (7 M Urea) that was run for 1.5 hours at 15 W, exposed to phosphor screen, and imaged on a Typhoon 9500 imager. In the samples that were not heated, hOGG1 forms the stable covalent complex (CC) with the DNA in the presence and absence of magnesium and a product containing an intact abasic site (AP15) that runs slightly lower on the gel than the unreacted 15mer substrate (°G15). There is a low abundance band that migrates at the expected size of the β elimination product generated from the hOGG1 lyase activity (LyP). This band represents ~1% of the total signal from each lane.

