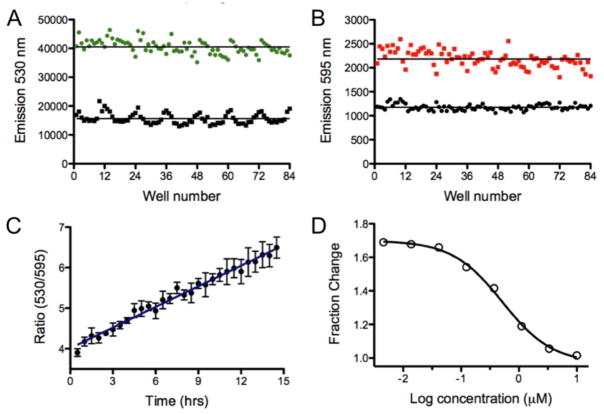
Figure 3.
Well-to-well variability before and after Dendra2 photoconversion in a 96-well plate. A) Emission of Dendra2 at 530 nm before (green) and after (black) the cells were exposed to 1 min of 405 nm LED flood array. B) Emission of Dendra2 at 595 nm before (black) and after (red) 1 min of 405 nm light. C) Ratiometric detection of newly synthesized Dendra2 measured over 15 hrs. D) Dose response for cycloheximide plotted as the fractional change in the 530 nm emission as a function of concentration (data was collected in triplicate).

