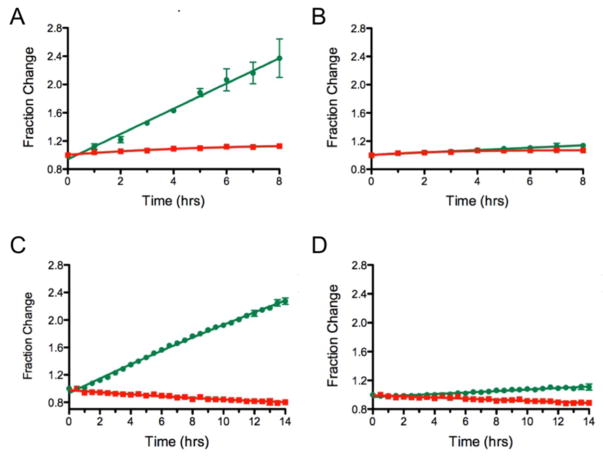
Figure 4.
Comparison of detection methods. A) Dendra2 production over 8 hrs as measured by live cell imaging shows a >2-fold increase in newly synthesized Dendra2 (green filled circles) without loss of photoconverted Dendra2 (red filled squares). B) Addition of 10 μM CHX inhibits the production of newly synthesized Dendra2 as measured by live cell imaging. C) Dendra2 production measured in 96 well plates over a period of 14 hrs in a fluorescence plate reader. D) Addition of 10 μM CHX inhibits Dendra2 production as measured with a fluorescence plate reader.

