Figure 5.
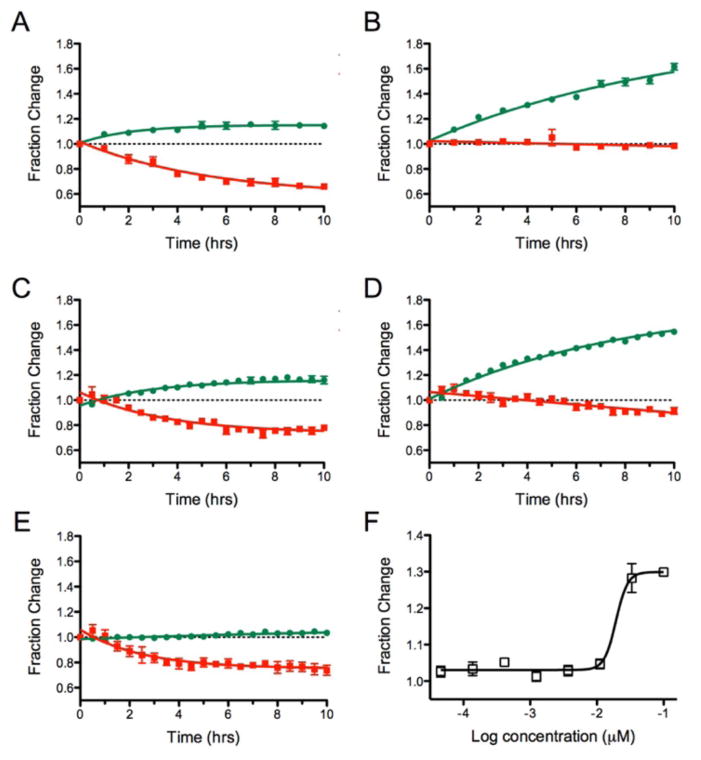
Comparison of results for IκBα-Dendra2 by live cell imaging versus a multi-well plate reader. A) Change in IκBα-Dendra2 over time after exposure to 1 min of 405 nm light as measured by live cell imaging. B) Addition of 0.1 μM Velcade followed by imaging. C) Change in IκBα-Dendra2 over time after exposure to 1 min of 405 nm light followed by change in protein emission over time measured in a plate reader. D) Addition of 0.1 μM Velcade; E) addition of 10 μM CHX. F) Dose response of Velcade with fraction change from the 530 nm emission plotted against concentration.

