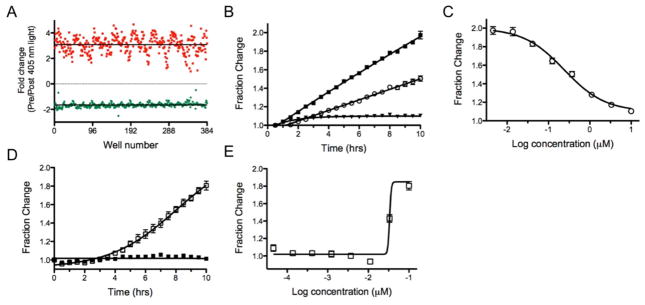
Figure 6.
Translation and proteasome inhibition assays in 384-well format. A) Well-to-well variability in emission of Dendra2 at 595 nm (red) and 530 nm (green). B) Fractional change in the emission signal at 530 nm for CHX inhibition of protein production with the HEK-Dendra2 cell line (filled squares = NC; open circles = 0.3 μM, filled triangles = 10 μM); C) Dose response for CHX inhibition of Dendra2 production at 10 hr time point. D) Velcade inhibition of IκBα-Dendra2 degradation (filled squares = NC; open squares = 0.1 μM Velcade). Fraction change is shown for the 530 nm emission signal. E) Dose response for Velcade inhibition of IκBα-Dendra2 degradation at 10 hr time point.

