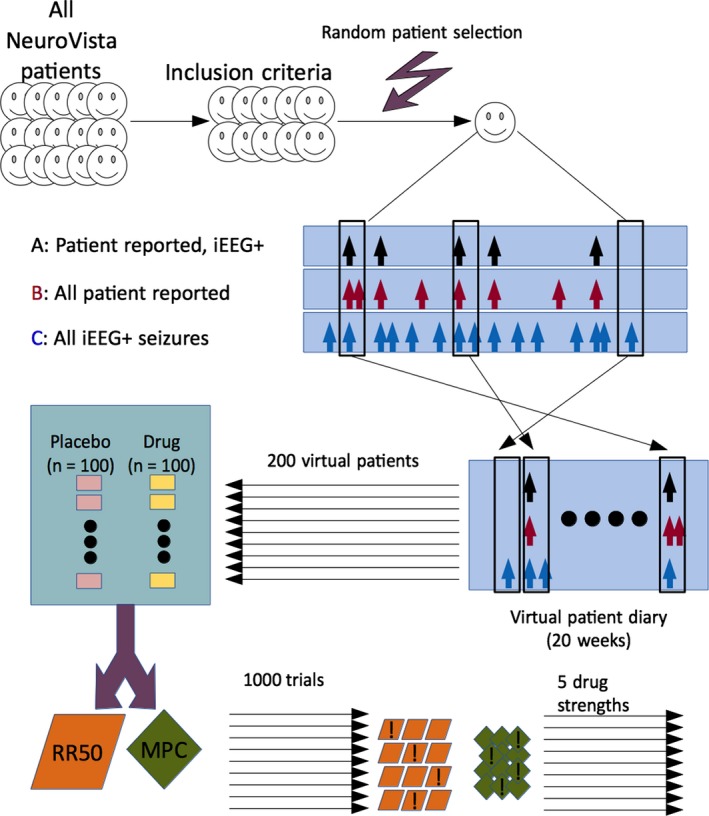
Figure 1.

Flow diagram. A subset of NeuroVista patients was used based on inclusion criteria. To generate one virtual patient, first a random patient was selected. Then, 20 windows of duration 1 week were selected, with random start times. The process was repeated 200 times for each clinical trial, which comprised 100 placebo patients and 100 drug patients. The trial was analyzed with the 50% responder rate (RR50) and the median percent change (MPC) methods. Some trials were successful (denoted with an exclamation mark) at distinguishing drug from placebo. For each of five drug strengths, 1,000 trials were simulated.
