
Figure 2.
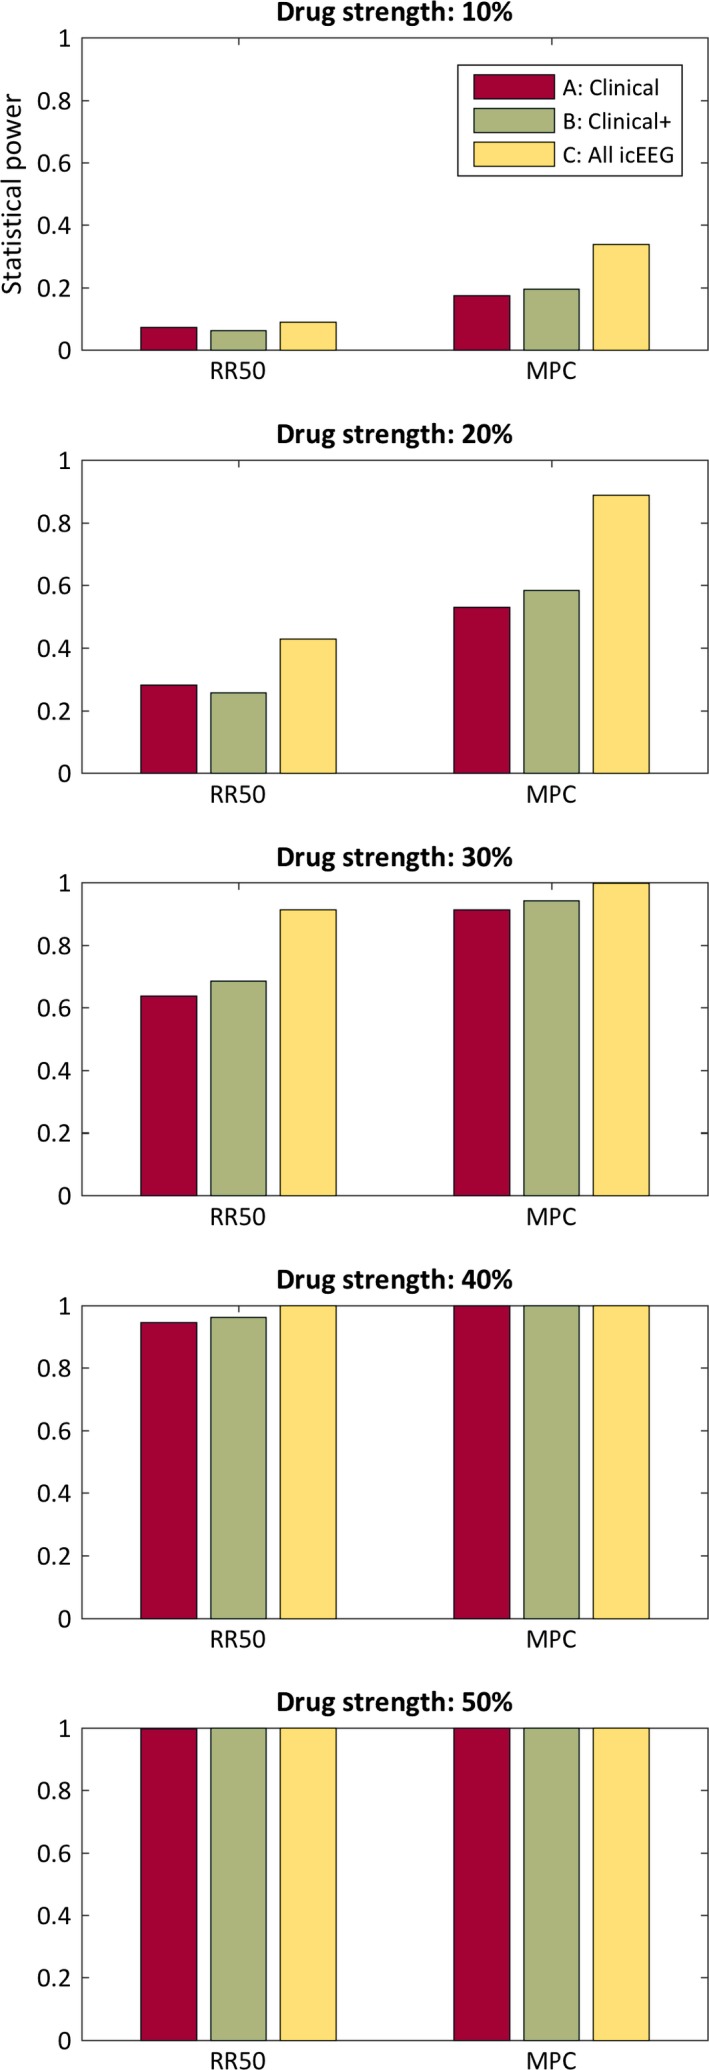
Statistical power. Each bar represents the percentage of 1,000 trials that achieved p < 0.05 statistical significance, which is an estimate of statistical power. A, clinically reported seizures with electrographic confirmation; B, all clinically reported events; C, all electrographically confirmed seizures; RR50, 50% responder rate, tested with Fisher's exact test; MPC, median percentage change, tested with the Wilcoxon rank‐sum test.