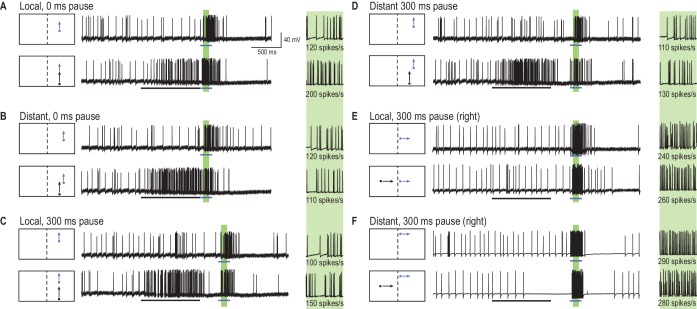
Figure 2. A primer target changes probe responses.
(A) Example traces of CSTMD1’s response to a probe target alone (blue arrow) or following a primer target (black arrow). The effect of the primer is measured as the difference (∆ spike rate) in response activity (primer & probe – probe alone) in the corresponding 100 ms window (green shaded region, with enlarged view on right). (B) With the primer spatially constrained, we repeat primer & probe and probe alone trials in a gridded array of 100 locations (200 trials in total, randomly interleaved). (C, D) A pause of 300 ms is inserted between the conditions where the primer disappears before probe onset (i.e. simulating a target occlusion). (E, F) A primer placed in the visual field of the other eye and moved toward the visual midline tests for information traversing the brain hemispheres.

