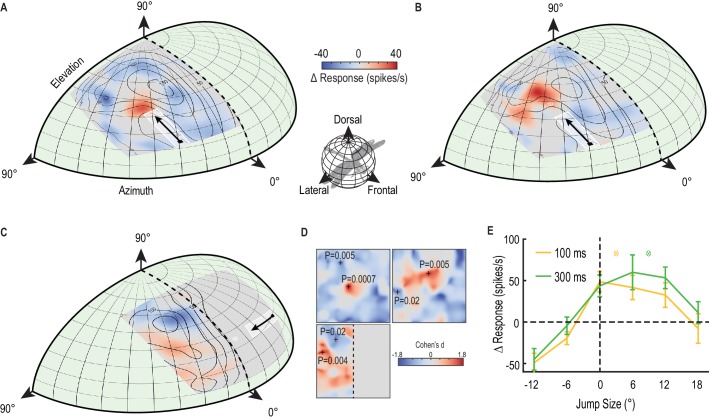
Figure 3. A predictive focus facilitates responses to a moving target.
(A) The probe receptive field in response to short, vertical trajectories is indicated by contour lines (mean, n = 9 dragonflies). The color map shows change in spike rate (for each location) due to the immediately preceding primer trajectory that is presented within the white outlined box. The change in spiking activity in the corresponding analysis window reveals >50% enhancement in front of the moving target (red), but suppression in the surround (blue). (B) With a 300 ms delay introduced after the primer, the focus spreads forward (color map, n = 7 dragonflies), estimating the theoretical future target location (white crosshairs). (C) The primer moves toward the midline in the other eye’s visual field, whilst avoiding binocular overlap. The focus transfers between brain hemispheres, with a spatially-localized enhancement in front of the target and suppression at higher elevations (color map, n = 7 dragonflies). (D) We examined the statistical significance of all three mappings (Figure A-C) by calculating the effect size at each spatial location (Cohen’s d). We see values within the range ±1.8, well above those considered as large effect sizes (>0.5). For spatial points of interest (+), we calculate the corresponding statistical significance (P value) between the primer & probe and probe alone versions (E) There is a forward shift in the focus region (mean ± SEM, p=0.03, n = 12 dragonflies) following an occlusion (cf. 100 ms pause, yellow line with 300 ms pause, green line). The expected target locations following occlusions are indicated with color crosshairs (3° for 100 ms and 9° for 300 ms).

