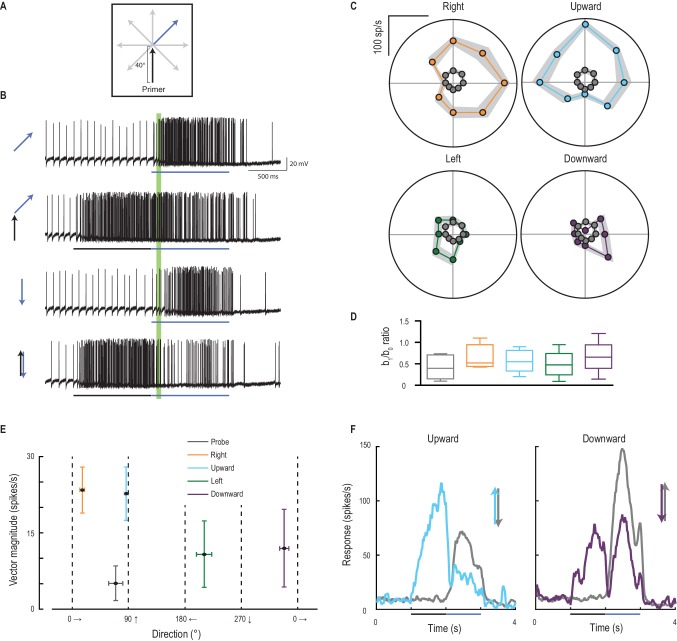
Figure 6. Primer direction establishes probe direction selectivity.
(A) Primers of four possible directions (right, upward, left, downward) preceded probe responses in each of eight possible directions. (B) Examples of individual traces to a subset of the experiment conditions. The analysis period is indicated in green. (C) Probe responses are weak (grey points) until following a primer (in one of four cardinal directions) and are most facilitated in the primer’s direction (mean ± SEM, n = 9 dragonflies). (D) The b1/b0 is an index showing the strength of directionality. (E) Polar plot vector magnitude and direction (mean ±95% CI), shows that probe direction selectivity generally aligns with the primer direction. (F) Either upward or downward probe alone (grey lines) evoke robust responses. However, ‘reversals’ (probes opposite in direction to a preceding primer) generate strong and long-lasting inhibition (mean time course, n = 9 dragonflies).

