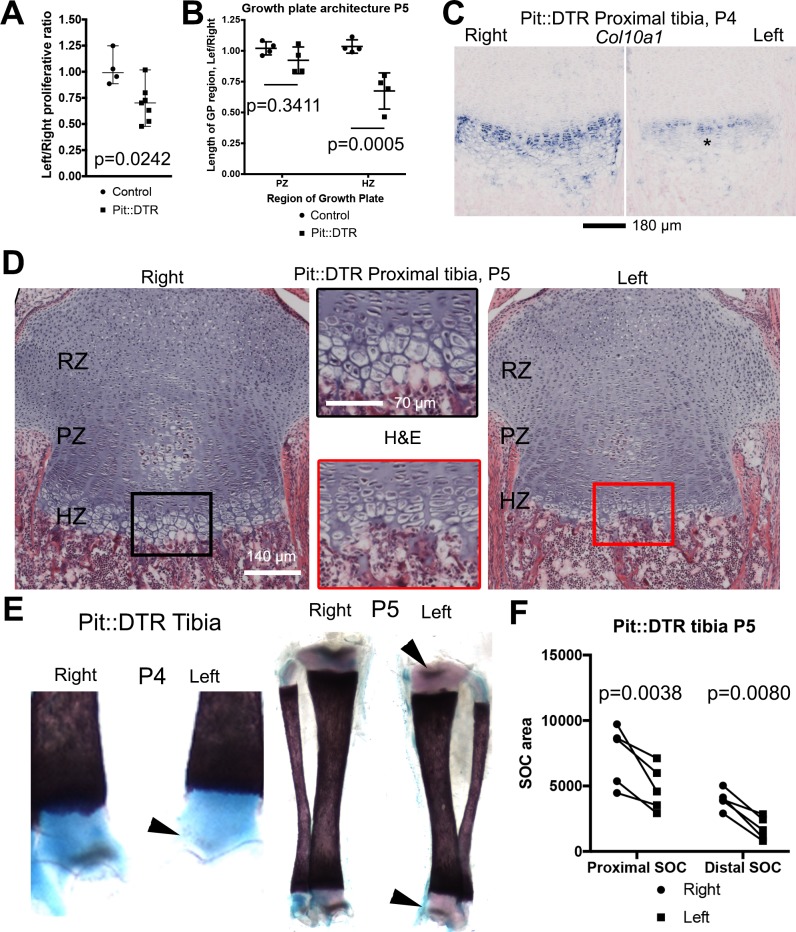
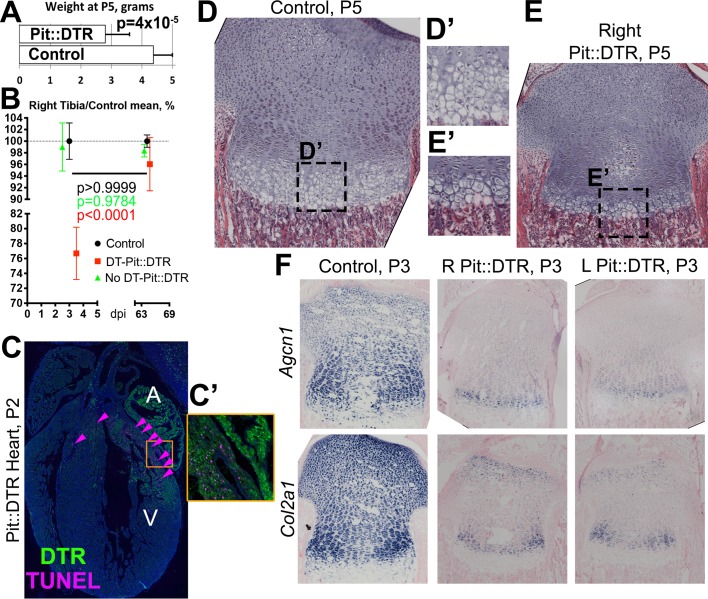
Figure 2. Reduced chondrocyte proliferation and maturation underlie the growth defect of the left bones of P1-Pit::DTR mice.
(A) The fraction of EdU+ nuclei in the PZ was calculated for left and right proximal tibia GPs 2dpi and represented as L/R ratio (mean ± SD). p-value for unpaired two-tailed Mann-Whitney test between control and experimental ratios is shown. (B, D) The PZ and HZ of left and right GPs were measured on hematoxylin and eosin-stained sections of P1-Pit::DTR proximal tibia GPs, 4dpi (D), and represented as L/R ratios (B) 3–4 sections per GP, n = 4 mice, mean ± SD are shown). 2-way ANOVA (variables: Genotype and GP region, alpha = 0.05, p-value=0.0118 for Genotype) followed by Sidak’s posthoc multiple comparisons test (p-values shown) was used. Insets in (D) show magnifications of the boxed regions. (C) RNA in situ hybridization for Col10a1 in the proximal tibia GP at 3dpi. (E, F) The secondary ossification centers (SOCs, arrowheads in E) appear later and their subsequent area (quantified in F) is reduced in the left P1-Pit::DTR skeletal elements. Analysis was done by 2-way ANOVA (variables: SOC location and Side, alpha = 0.05, p-value=0.0003 for Side) followed by Sidak’s posthoc multiple comparisons test (p-values shown in Figure). Asterisk= reduced expression. See also associated Figure 2—figure supplement 1.


