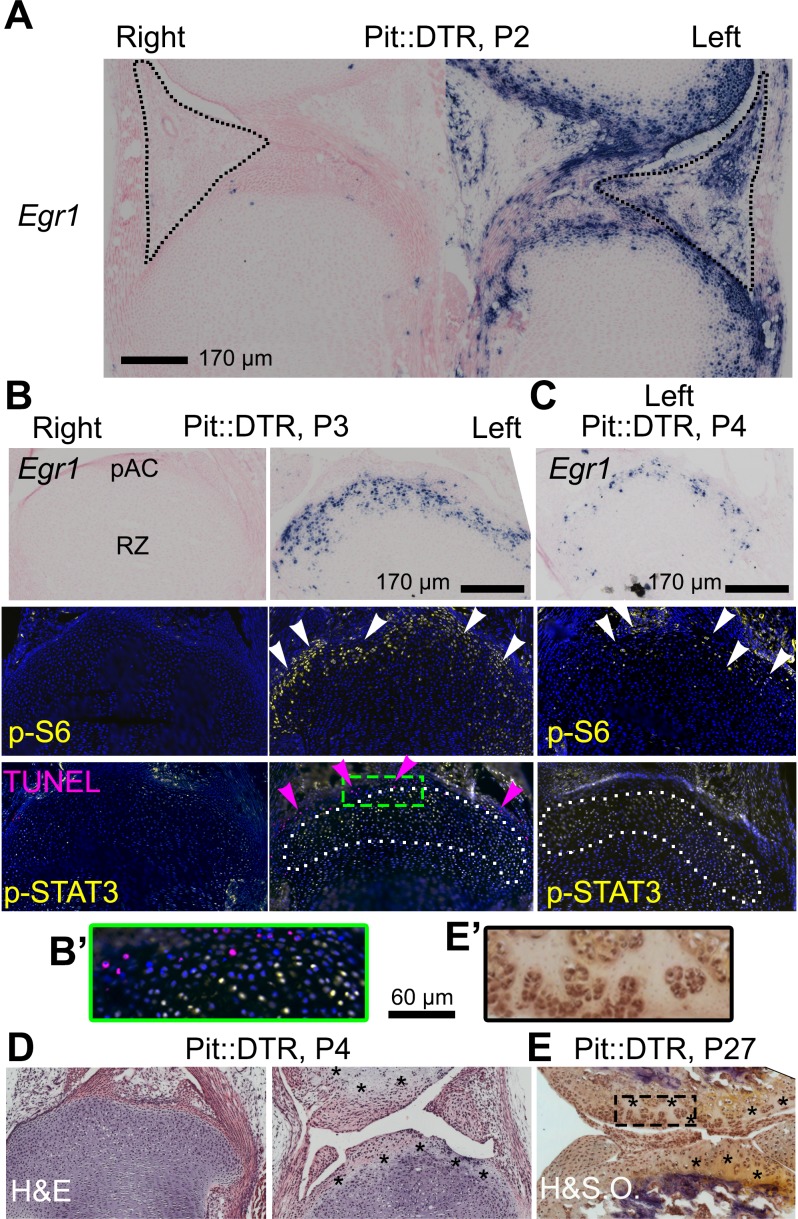
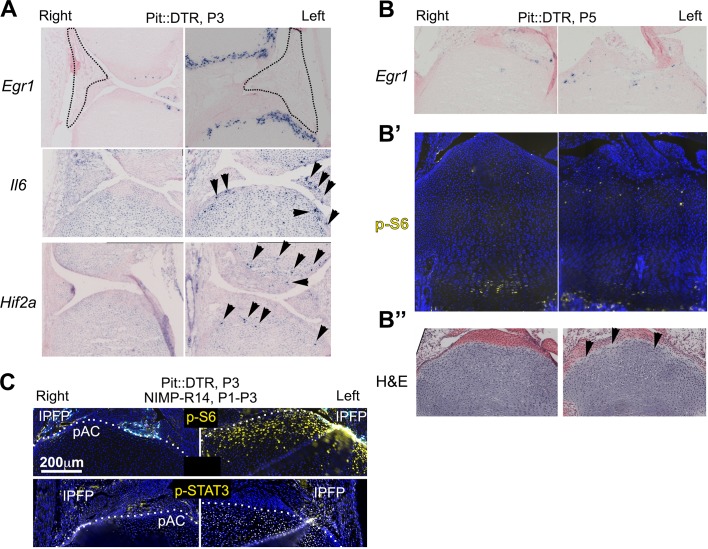
Figure 5. The injury response in the articular cartilage of P1-Pit::DTR mice correlates with signaling changes in the resting zone and impaired bone growth.
(A) Expression of the immediate-early marker Egr1 1dpi. Dotted area= IPFP. (B, C) Expression of Egr1 and the indicated signaling effectors (white arrows) and cell death (pink arrows) in the prospective articular cartilage (pAC), two (B) and three dpi (C). Dotted area= extent of p-STAT3 signal. (D, E) Hematoxylin and eosin (H&E) and hematoxylin and safranin O (H&SO) analysis of the pAC/AC, showing extensive damage at P4 (D), persistent at P27 (E). Magnifications of the boxes in (B) and (E) are shown in (B’) and (E’), respectively. See also associated Figure 5—figure supplement 1.


