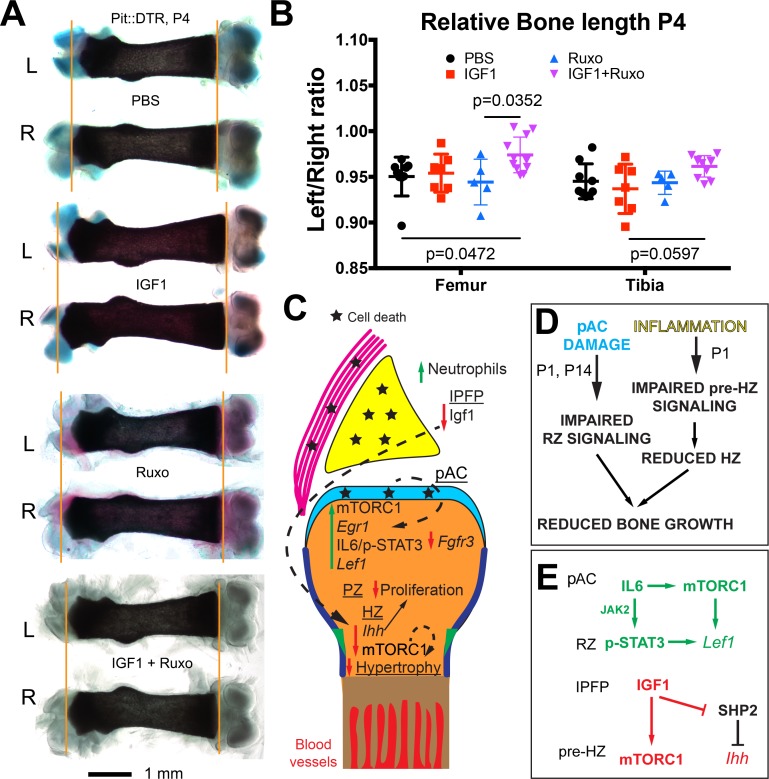
Figure 6. Combined inhibition of the injury response cascade and intraarticular IGF1 injection rescues DT-impaired femur growth.
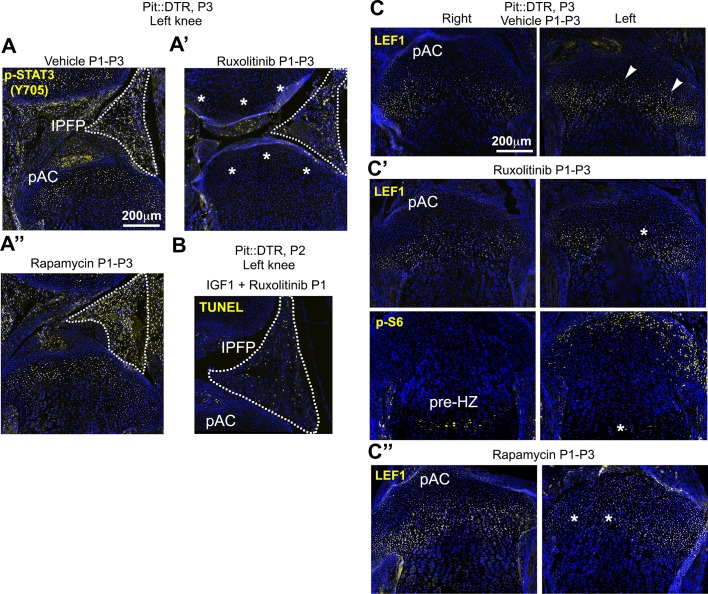
(A, B) Representative femur preparations (A) and quantification of left/right length ratio of P1-Pit::DTR bones at P4 (B) after in vivo treatment with the indicated substances (n = 8, 7, 5, 11 for PBS, IGF1, Ruxo, IGF1+Ruxo, respectively). The parallel treatments were compared by two-way ANOVA with Bone and Treatment as variables (alpha = 0.05, p=0.0066 for Treatment, 0.0678 for Bone), followed by Sidak’s posthoc multiple comparisons test (only the p-values lower or close to 0.05 are shown in the Figure). (C, D) Summary of signaling changes in the IPFP and pAC after mesenchymal cell death outside the GP, and their interaction with GP signaling and bone growth. In (D), the postnatal stages at which each pathway operates are indicated. (E) Speculative model for the regulation of Lef1 and Ihh in the experimental GP. Green/Red lettering indicates, respectively, pathways up/downregulated following inflammation and injury response. See also associated Figure 6—figure supplement 1.


