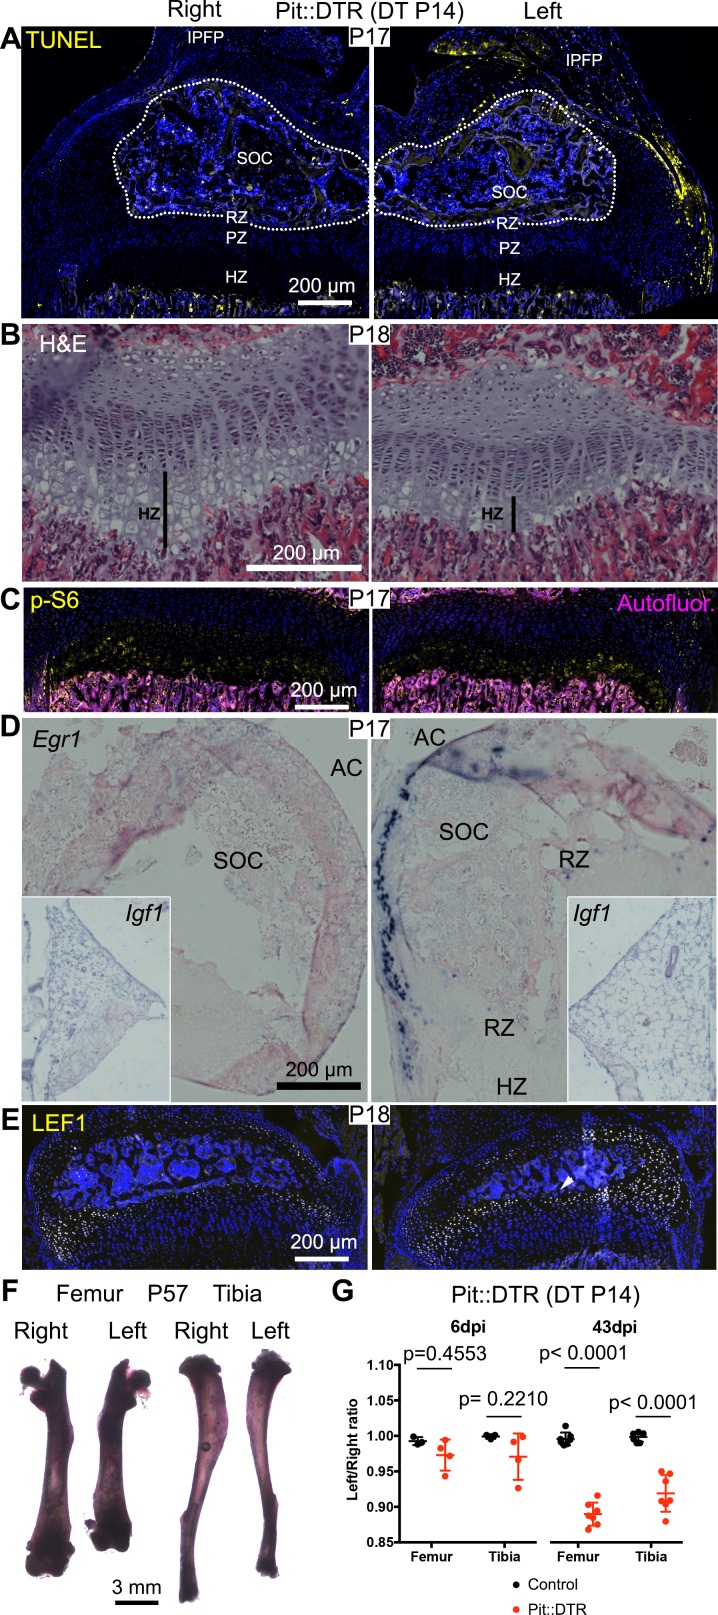
Figure 7. Induction of soft-tissue cell death at P14 also impairs bone growth.
(A) TUNEL staining (arrowheads) in sagittal section of P17 proximal tibia from Pit::DTR mice injected DT at P14 (P14-Pit::DTR). SOC= secondary ossification center (outlined). (B) Hematoxylin and eosin-stained sagittal sections of P18 distal femur from P14-Pit::DTR mice. Vertical bars indicate the length of the HZ. (C) Immunostaining for p-S6 in the GP of P14-Pit::DTR mice at P17. (D, E) In situ hybridization for Egr1 (D) and Igf1 (D, insets) and LEF1 immunostaining (E) in knees from P14-Pit::DTR mice. (F) Alizarin red staining of the skeletal elements from a representative P14-Pit::DTR mouse at P57. (G) Quantification of the left/right length ratio for femora and tibiae of P20 and P57 Control and P14-Pit::DTR mice. Analysis was done by 2-way ANOVA (alpha = 0.05, Bone Identity and Genotype as variables, p-value for Genotype was 0.1970 at P20 and < 0.0001 at P57) followed by Sidak’s posthoc multiple comparisons test (p-values shown in Figure). Arrowheads denote ectopic expression. AC= articular cartilage. RZ, PZ, HZ= resting, proliferative, hypertrophic zones. IPFP= infrapatellar fat pad. See also associated Figure 7—figure supplement 1.


