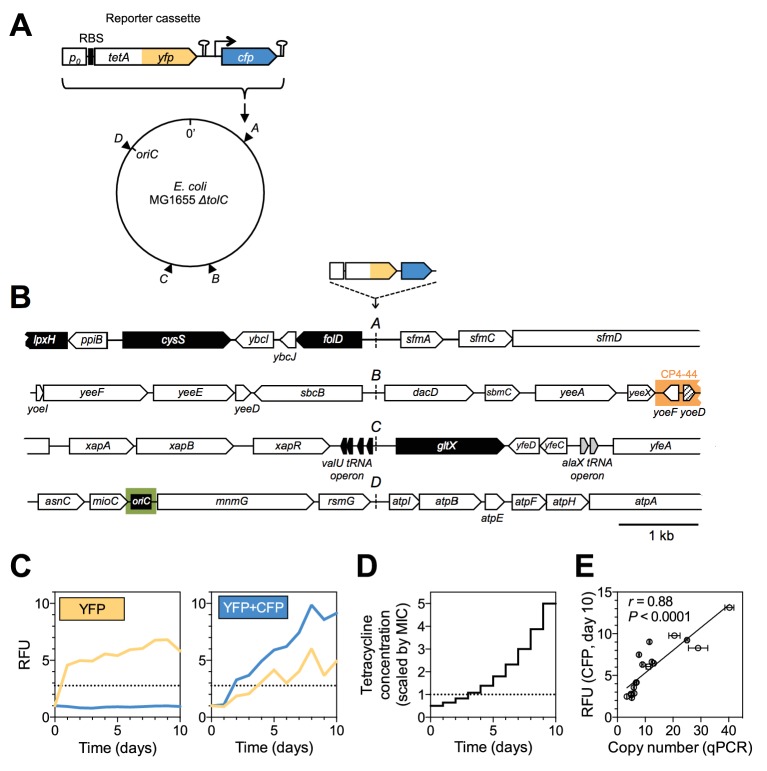
Figure 1. A dual-fluorescence reporter cassette for real-time tracking of adaptive mutations of different types.
(A) Reporter cassette construct for chromosomal insertion. p0 = 188 bp random DNA sequence, RBS = ribosomal binding site, hairpins = transcriptional terminators, tetA-yfp = selected gene, cfp = constitutively expressed amplification reporter. A, B, C, D = intergenic chromosomal insertion loci, oriC = origin of replication. (B) Immediate chromosomal neighborhoods of loci A-D. Black arrows = essential genes. White arrows = non-essential genes. Grey arrows = no essentiality data available. Patterned arrow (yoeD) = pseudogene. Orange = cryptic prophage CP4-44. Green = origin of replication (oriC). Chromosomal neighborhoods of loci B, C, and D are shown reversed with respect to conventional chromosome coordinates, so that the orientation relative to the reporter cassette is shown in the same way for all four loci. Reporter cassette genes are not drawn to scale. (C) Example fluorescence trajectories of rescued populations with YFP or YFP+CFP (amplification) fluorescence phenotype. RFU = relative fluorescence units (see Methods), yellow and blue lines = YFP and CFP fluorescence, dotted lines = threshold for phenotype classification. (D) Increase of tetracycline concentration in ten-day experiment, normalized to strain-specific minimal inhibitory concentration (MIC, dotted line). (E) qPCR validation of CFP fluorescence as an indicator of extent of amplifications. x-axis: tetA-yfp copy number as determined by qPCR on genomic DNA of rescued population with a YFP+CFP fluorescence phenotype. Error bars = SD of technical qPCR triplicates. r is the Pearson correlation coefficient and P its p-value. RFU = relative fluorescence units, line = linear fit.
DOI: http://dx.doi.org/10.7554/eLife.25100.002


