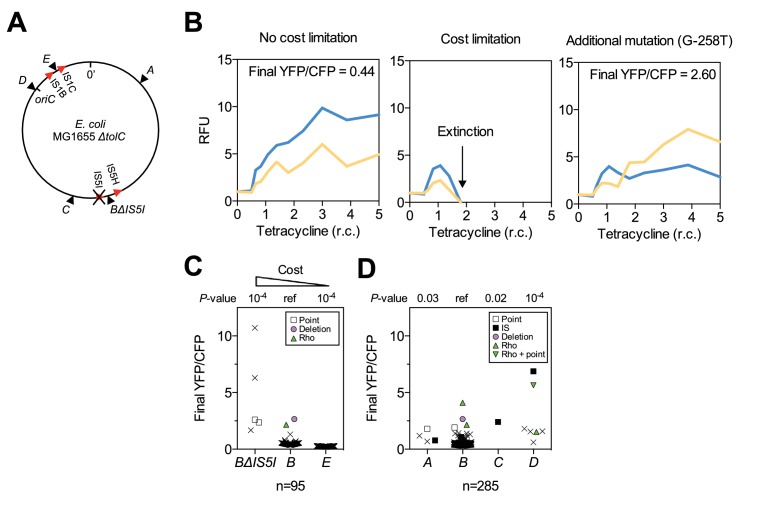
Figure 5. Chromosomal neighborhood influences the fitness cost of amplifications.
(A) Chromosomal location of reporter cassette in strains BΔIS5I and E (IS distances not drawn to scale). (B) Example fluorescence trajectories. Left: low-cost amplifications expand in correlation with the increase in tetracycline concentration over 10 days. Middle: Cost-limited amplifications fail to expand at higher tetracycline concentrations resulting in extinction. Right: Amplifications can escape extinction in combination with other mutations increasing tetA-yfp expression, resulting in higher final YFP/CFP. RFU = relative fluorescence units (see Materials and methods), r.c. = relative concentration as multiples of MIC. (C) Final YFP/CFP ratios of rescued amplifications in strains expected to have a higher (strain BΔIS5I) or lower (strain E) cost of amplifications compared to strain B. n = initial number of replicate populations used for analysis. Crosses = populations rescued by amplifications without additional mutations. Other symbols = secondary mutations (see legend). p-values: permutation tests in comparison with strain B. (D) Final YFP/CFP ratios of rescued amplifications in strains A-D. n = 285 includes replicate evolution experiments to increase statistical power. Symbols and p-values as in (C).
DOI: http://dx.doi.org/10.7554/eLife.25100.023
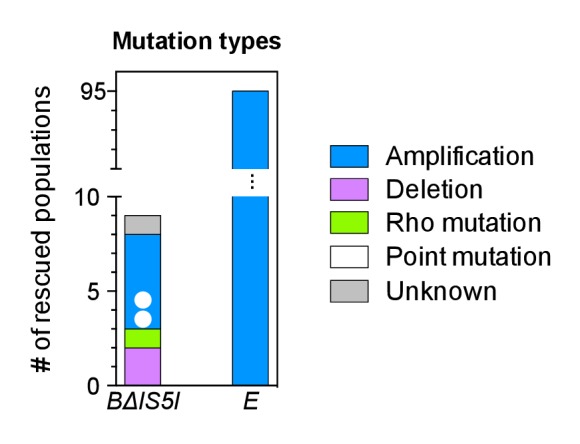
Figure 5—figure supplement 1. Rescued populations of strains BΔIS5I and E by mutation type.


