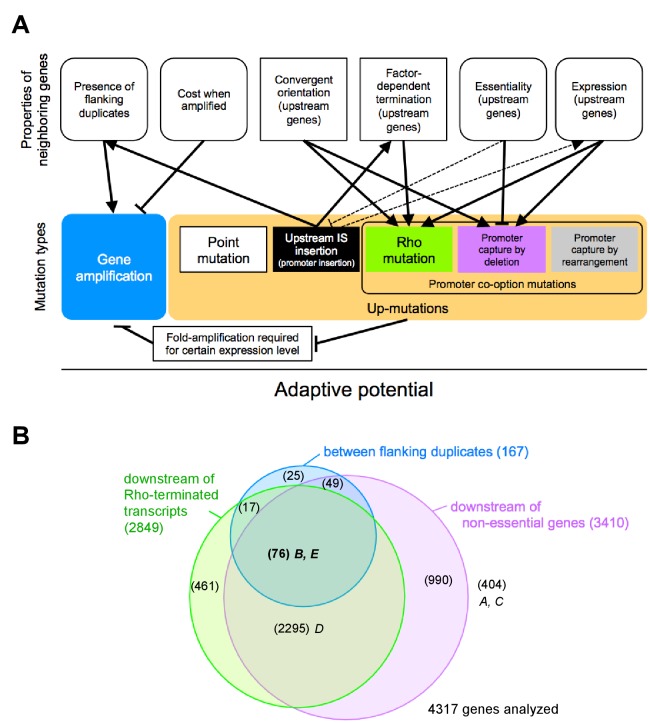
Figure 7. The adaptive potential of a gene under selection for increased gene expression as a complex function of properties of neighboring genes that affect and are affected by mutations of diverse types.
(A) Top row: Properties of neighboring genes that we identify as main determinants of the adaptive potential of a gene given its chromosomal neighborhood. Round corners indicate ‘dynamic’ properties that may be environment-dependent or subject to change over short evolutionary timescales. Bottom row: Different mutation types causing increased expression of a gene. Solid arrows: Effects and interactions shown or suggested by data in this study. Dashed arrows: Other effects and interactions that are likely to exist. Pointed arrowheads indicate a positive effect, T-bar ends indicate a negative effect. A sentence equivalent of each arrow is given in Figure 7—source data 1. As a sum of the above interactions, the adaptive potential of a gene emerges as a system-property. (B) Classification of chromosomal neighborhoods of E. coli genes according to adaptive potential. The chromosomal neighborhood of 4317 genes of E. coli MG1655 was assessed using published information on the position of promoters and terminators (Conway et al., 2014) and gene essentiality (see Methods for details). Numbers in parentheses = genes belonging to respective sets or intersections of sets. Genes in the intersection of all three circles (boldface) are expected to have the highest adaptive potential based on their chromosomal neighborhood. Loci A-E of this study are placed in the respective areas of the diagram.
DOI: http://dx.doi.org/10.7554/eLife.25100.033

