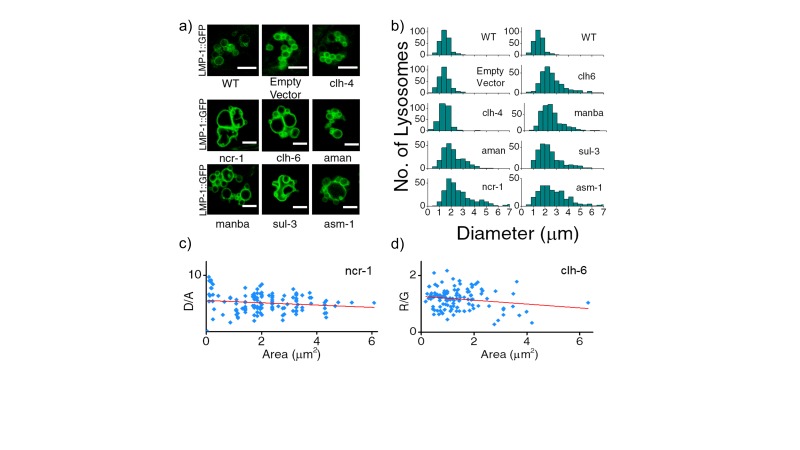
Scale bar: 5 μm. (
b) Histograms comparing the spread in size of LMP-1::GFP positive vesicles in coelomocytes in the indicated RNAi background (n = 20 cells). (
c) D/A values obtained for individual pH measurements in lysosomes as a function of area of each vesicle in the indicated genetic background. The linear regression is shown in red. The coefficient of regression (p = ‒0.14) shows no correlation (n > 100 lysosomes). (
d) R/G values obtained for individual Cl
- measurement in lysosomes as a function of area of each vesicle in the indicated genetic background. The linear regression line is shown in red. The coefficient of regression (p= ‒0.18) shows no correlation (n > 100 lysosomes). A key phenotype observed in cells derived from patients suffering from lysosomal storage disorders (LSD) is the presence of enlarged lysosomes (
Filocamo and Morrone, 2011;
Platt et al., 2012). LSD-related gene knockdowns in worms show subtle to no observable whole organismal phenotypes (
de Voer et al., 2008). However, on knocking down various LSD-related genes in the background of LMP-1::GFP worms we observed that the morphology of LMP-1 positive vesicles were altered and that the coelomocytes contained enlarged lysosomes, some as large as eight microns in diameter (
Figure 3—figure supplement 1).
Figure 3—figure supplement 1b represents a plot of the diameter distribution for LMP-1 positive vesicles under each indicated genetic background. Worms with LSD-related gene knockdowns show a broader distribution of vesicle sizes compared to a more tightly regulated size distribution in wild type nematodes or non-LSD related mutants. example for when
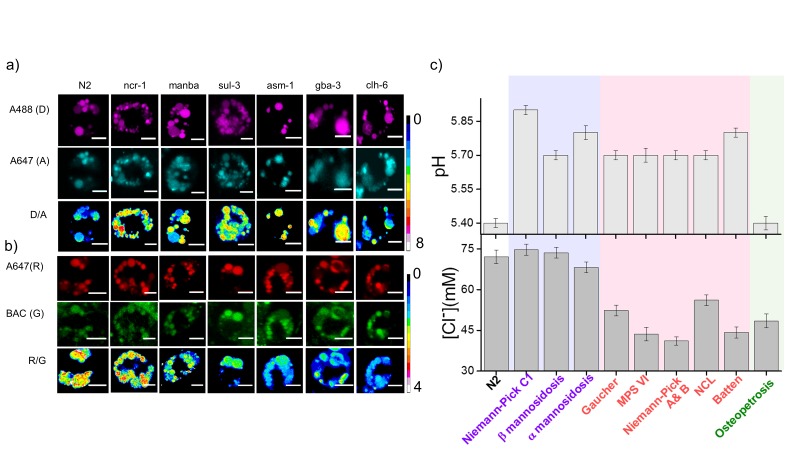
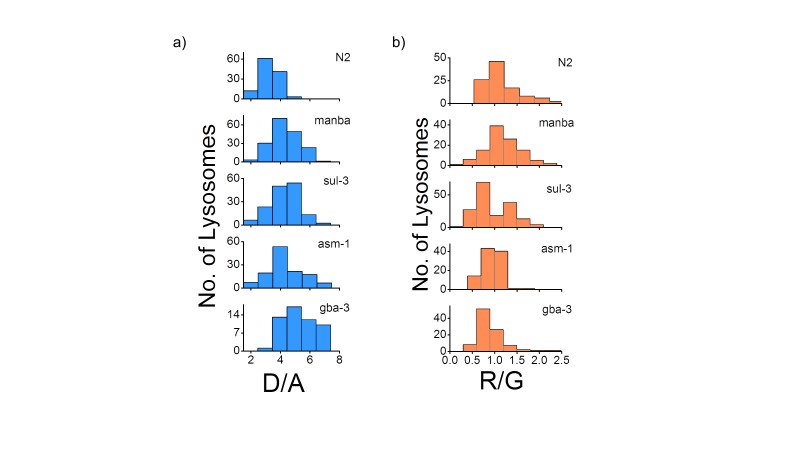
clh-4, a plasma membrane resident chloride channel was knocked down, lysosomal morphology is not affected. We carried out pH and chloride measurements for worms from various genetic backgrounds and checked for correlations between lysosomal D/A (or R/G) and lysosome size. On plotting D/A values obtained from pH measurements in
ncr-1 RNAi worms, against the area of each vesicle; we observe no correlation between the two parameters (
Figure 3—figure supplement 1c). A similar observation is seen in the case of chloride R/G measurements (
Figure 3—figure supplement 1d). Thus assaying only for lysosome size shows no correlation with lysosome functionality. However lumenal chloride concentration is the best correlate of lysosome dysfunction, irrespective of size.


