
Figure 2. daf-2 mutants maintain vigor longer but have an extended period of immobility at the end of life.
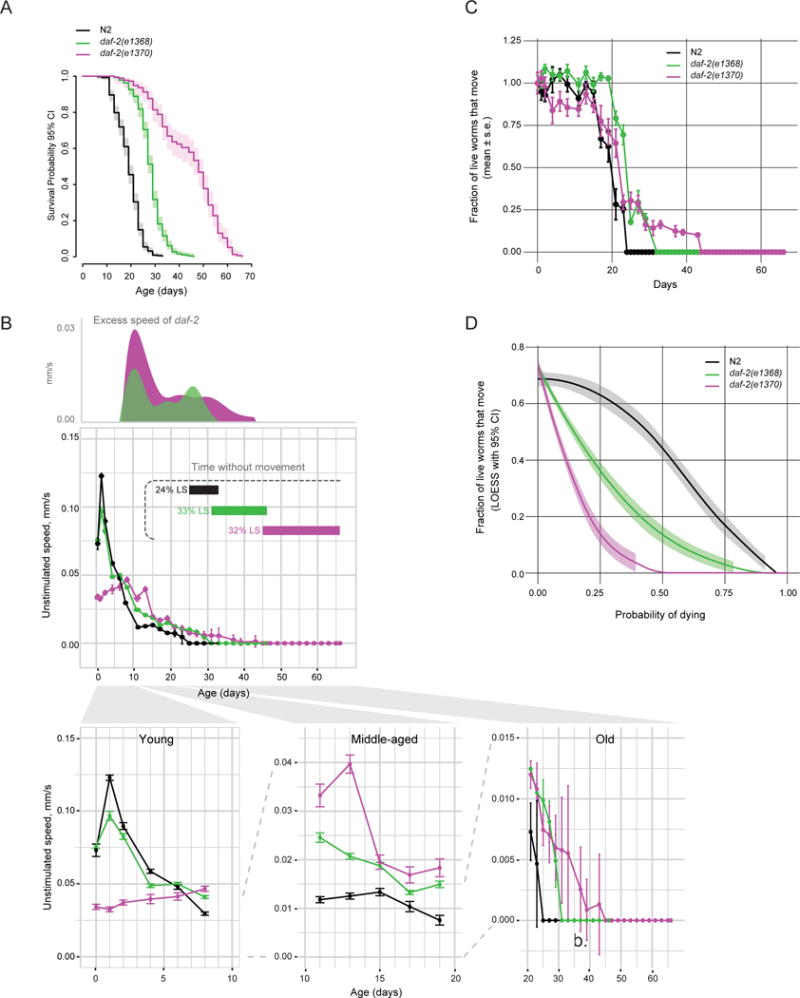
a) Survival analysis of daf-2(e1368) and daf-2(e1370) mutants under standard growth conditions. b) Unstimulated movement speed of detected animals as a function of adult age. Excess speed of daf-2 mutants is calculated by subtracting wild-type speed from mutant speed. Locomotion of young, middle-aged and old animals is also plotted separately below. Horizontal bars indicate duration of life and proportion of maximal lifespan without any detectable movement in the population. See Figure S1D for analysis of stimulated movement. n > 200 on day 0. c) Fraction of live worms exhibiting detectable movement at a given age. The data are averages of 8 independent replicate plates with 30–50 worms per plate on day 0. d) Same as (c) but plotted versus survival probability (i.e. normalized to lifespan). If every animal exhibited movement right until death regardless of whether it died early or late (i.e. there were no late-life decrepitude), this plot would be a straight horizontal line. Local polynomial regression (LOESS) fit with a 95% confidence interval is shown. Figure S1E–F shows stimulated and unstimulated speed scaled to maximal lifespan. Figure S2A–E shows early and late-life movement phenotypes in additional daf-2 mutants. Table S1 shows survival statistics for all lifespan experiments.