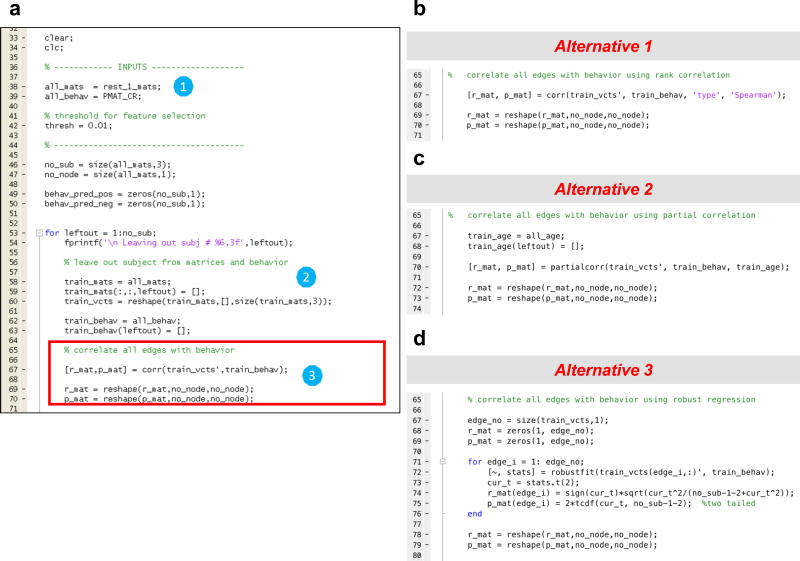
Figure 3. Example CPM code for step 1–3.
a) (1) Load connectivity matrices and behavioral data into memory. (2) Divide data into training and testing sets for cross validation. In this example, leave-one-out cross-validation is used. (3) Relate connectivity to behavior. In this example, Pearson correlation is used. Note that the code outlined with a red box in (a) may be replaced with any of three alternatives in the right hand panels: b) rank (Spearman) correlation; c) partial correlation; d) robust regression.

