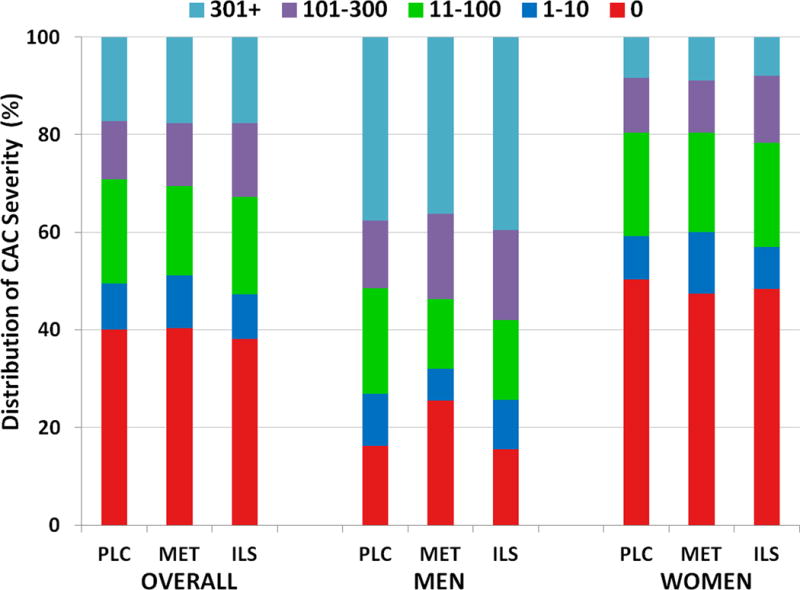
Fig 2. Distribution of CAC Scores by Treatment Group and Sex.

Each bar depicts the percent prevalence of CAC severity by color-coded severity category. There were no differences between CAC severity categories among treatment groups overall (p=0.69) or among men (p=0.08) or women (p=0.50)
