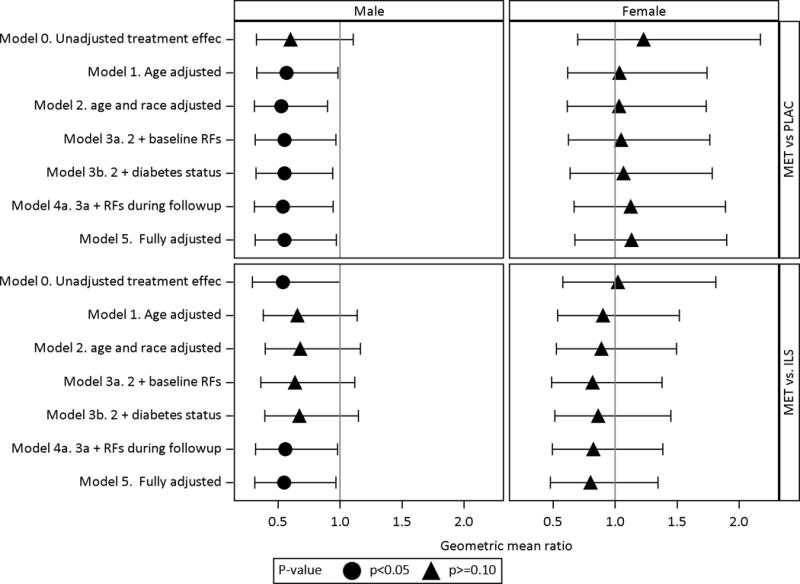
Fig 4. Adjusted treatment effects of metformin vs. placebo (MET vs PLAC) and metformin vs. lifestyle (MET vs. ILS) on CAC severity stratified by sex.

The treatment effects are stratified by sex along the columns, displayed along the rows and expressed as geometric mean ratio of metformin compared to placebo (MET vs. PLAC) and metformin compared to lifestyle (MET vs. ILS). The geometric mean ratio is calculated by taking the anti-log of the treatment effect coefficient from obtained the Tobit regression model with ln(CAC+1) as the outcome. Adjustments to the treatment effects are sequentially modeled as defined below. Baseline risk factors include family history of premature CVD, BMI, HbA1c, ln(ACR), non-HDL-C, HDLc, SBP, eGFR by CKD-epi, ln(CRP), ever smoke status. Risk factors during follow-up include mean levels for BMI, HbA1c, ln (ACR), non-HDL-C, BMI, ln(CRP), SBP, ACR, eGFR and years of statin.
MODEL 0 Unadjusted treatment effect
MODEL 1 Adjusted for age only
MODEL 2 Adjusted for demographics: Model 1 + demographics (age, race/ethnicity)
MODEL 3a Adjusted for baseline RFs: Model 2 + baseline risk factors (Family history of premature CVD, BMI, HbA1c, ACR, non-HDL-C, HDL-C, SBP, eGFR by CKD-epi, CRP, ever smoke status)
MODEL 3b Adjusted for demographics and diabetes status: Model 2 + diabetes status at the time of the scan
MODEL 4a Adjusted for demographics, risk factors at baseline and during follow-up : Model 3a + risk factors during follow-up
MODEL 4b Adjusted for demographics, risk factors at baseline and diabetes status: Model 3a + diabetes status
MODEL 5 Fully adjusted: Model 4A + diabetes status and duration
