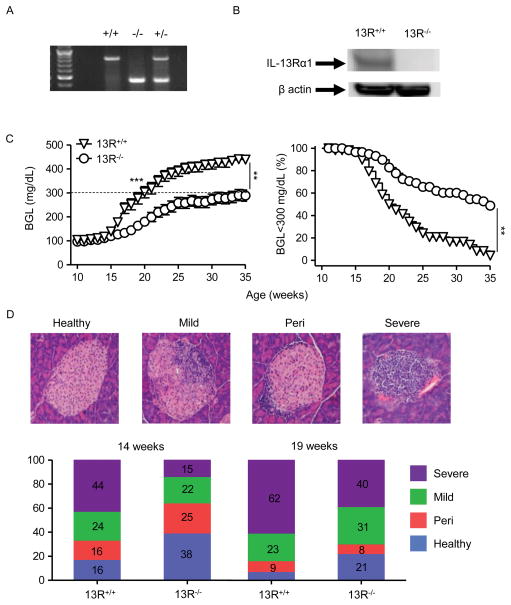
Figure 1. 13R−/− NOD mice display resistance to T1D.
(A) PCR analysis showing bands for IL-13Rα1 in wild-type 13R+/+ (828 bp), homozygous 13R−/− (466bp) and heterozygous 13R+/− (828 and 466 bp) NOD mice. (B) Shows expression of IL-13Rα1 in intestinal cells from 13R+/+ and 13R−/− mice as determined by Western blot using an anti–IL-13Rα1 Ab. (C) The left panel shows BGL in female 13R+/+ and 13R−/− NOD mice from week 10 to 35 of age. Each group included 62 mice. The right panel shows the percentage of mice with BGL lower than 300 mg/dl among the 62 animals enrolled in the 10–35 week monitoring period. **p<0.005 and ***p<0.0001 as determined by Mann-Whitney U test. (D) The top panel shows H & E staining (100x) of pancreatic sections from either normal, hyperglycemic or diabetic mice covering the scoring scale used for classification of islet infiltration. From left to right the islet are scored as healthy, mild, peri or severely infiltrated. The bottom panel shows islet infiltration severity scores for 13R+/+ and 13R−/− mice at 14 weeks (onset of differential BGL from C) and 19 weeks (onset of diabetes in 13R+/+ mice from C) of age (n = 7 per group).

